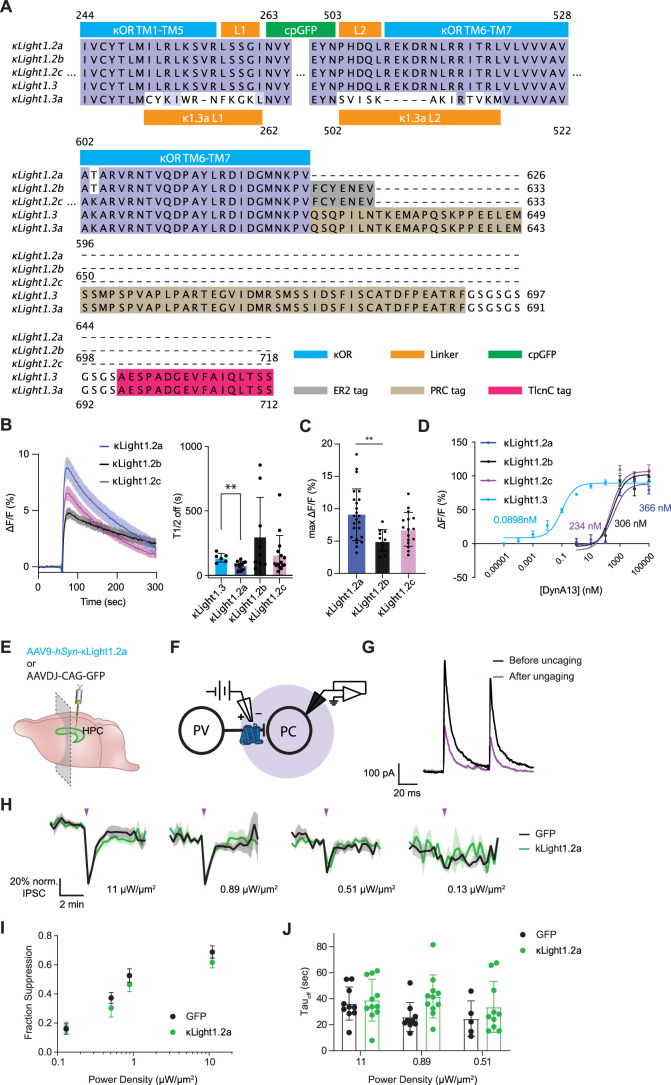
Extended Data Fig. 3. Comparison of top κLight variants and buffering effect study.
(a) Sequence alignment of κLight1.2a, κLight1.2b, κLight1.2c, κLight1.3, and κLight1.3a. Purple indicates the same residues across all variants. Blank indicates different residues. Blue color indicates κOR sequence. Orange indicates linkers. Green indicates cpGFP sequences. Gray indicates the sequence for the ER2 tag. Khaki indicates the sequence for the PRC tag, and magenta indicates the TlcnC tag. (b) (left) CYD8 uncaging response comparison between κLight1.2a (dark blue, n = 12 videos), κLight1.2b (black n = 9 videos), and κLight1.2c (magenta, n = 15 videos) expressed in dStr in acute brain slices. The solid line represents the mean, and the shaded area represents SEM. (right) κLight1.2a showed faster T1/2 off dynamics compared to κLight1.3 (κLight1.3 T1/2 extracted from Fig. 3c, 137 ± 14, n = 6; κLight1.2a, 79 ± 8.9, n = 12; κLight1.2b, 301 ± 101, n = 9; κLight1.2c, 156 ± 40, n = 15, **p = 0.001, one-way ANOVA). Error bars represent SEM. (c) Max ΔF/F (%) at the peak of the CYD8 uncaging responses for κLight1.2a (blue, n = 24 videos), κLight1.2b (black, n = 11 videos), and κLight1.2c (magenta, n = 16 videos). κLight1.2a: 9.09 ± 0.8 %, κLight1.2b: 5.1 ± 0.5 %, κLight1.2c: 6.84 ± 0.7 %. **p = 0.0027, ordinary one-way ANOVA with Dunnett’s multiple comparisons test. Error bars represent SEM. (d) Dose response curves for DynA13 at κLight1.2a (dark blue, n = 3 wells, EC50 = 366 nM), κLight1.2b (black, n = 5 wells, EC50 = 306 nM), κLight1.2c (magenta, n = 4 wells, EC50 = 234 nM), and reused κLight1.3 trace from Fig. 1e (blue, n = 4 wells, 0.0898 nM). Error bars represent SEM. (e) Schematic indicating injection of C57/B6J pups with AAV1-hSyn-κLight1.2a or AAV-DJ-CAG-GFP in the hippocampus followed by 3 weeks of expression prior to preparation of acute brain slices for electrophysiology. (f) Schematic of the electrophysiological recording configuration. Whole-cell voltage-clamp recordings are obtained from pyramidal cells (PCs) held at 0 mV while parvalbumin (PV) basket cell axons are preferentially stimulated with a narrow-tipped theta-glass-based bipolar stimulating electrode. Two electrical stimuli are applied 50 ms apart to drive synaptic inhibition. A 5 ms flash of 355 nm light (semitransparent purple circle) is applied to photorelease DynA8, which acts on presynaptic mu and delta opioid receptors on the PV cell to suppress the synaptic output. (g) Example inhibitory post-synaptic currents (IPSCs) before (black) and after (purple) DynA8 photorelease. (h) Time-course of IPSC suppression in response to DynA8 photorelease in slices expressing κLight1.2a (n = 13 cells from 3 mice, green) or GFP (n = 10 cells from 3 mice, black) using different intensities of UV light. Traces indicate the mean peak IPSC (normalized to 100%) over time, which was probed every 20 sec. Purple arrows indicate the application of UV light. The solid lines represent the mean, and the shaded areas represent SEM. (i) Power-response curve summarizing the fraction of the baseline IPSC suppressed by DynA8 photorelease in slices expressing κLight1.2a (n = 13 cells from 3 mice, green) or GFP (n = 10 cells from 3 mice, black). No significant differences were detected at different power densities (Two tailed multiple Mann-Whitney tests between GFP and κLight1.2a at different power densities: 0.13 µW/µm2: p = 0.91, 0.51 µW/µm2: p = 0.71, 0.89 µW/µm2: p = 0.71, 11 µW/µm2: p = 0.70, non-significant). (j) Average time constant of IPSC recovery after DynA8 photorelease in slices expressing κLight1.2a (n = 3 mice, green) or GFP (n = 3 mice, black). No significant differences were detected (Two tailed multiple Mann-Whitney tests between GFP and κLight1.2a at different power densities: 0.51 µW/µm2: κLight1.2a n = 10 cells, GFP n = 5 cells, p = 0.52; 0.89 µW/µm2: κLight1.2a n = 11 cells, GFP n = 9 cells, p = 0.04; 11 µW/µm2: κLight1.2a n = 11 cells, GFP n = 10 cells, p = 0.56, non-significant). Error bars represent SEM.

