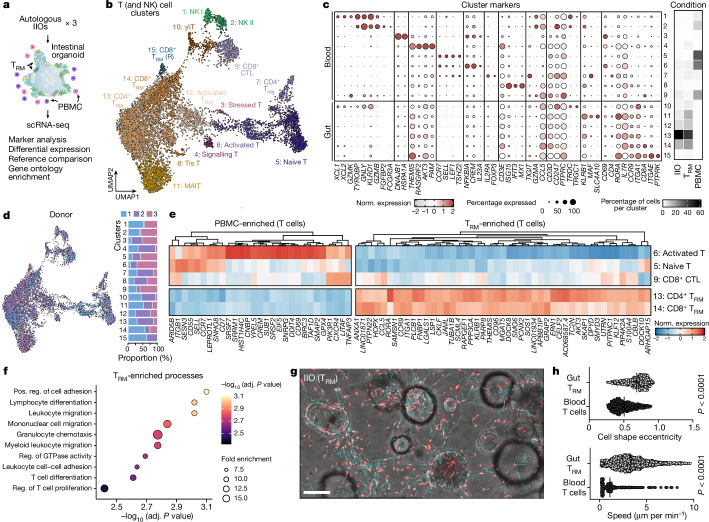
Fig. 2. Tissue-resident transcriptomic signatures and migratory behaviour underlie TRM cell epithelial insertion and IIO formation.
a, Overview of single-cell transcriptome analysis of organoids containing patient-matched TRM cells and PBMCs. Data were generated from TRM cells alone (TRM), organoids containing TRM cells (IIO) and organoids containing PBMCs (PBMC) from three small intestine donors (one jejunum, one duodenum, one undefined small intestine). Organoid schematic adapted with permission from ref. 60, human schematic adapted from ref. 61. b, Integrated UMAP embedding of transcriptome data from immune cells of each condition, showing 15 distinct cell clusters (colours, numbers) labelled based on analysis of marker genes (see Extended Data Fig. 2 for the entire dataset). R, resting. c, Dotplot summarizing marker gene expression across different clusters. Heatmap sidebar shows proportional distribution of each condition across clusters. d, Left, immune cell UMAP with each cell coloured by donor; right, stacked barplot showing donor cell proportion in each cluster in which each column sums to 100. e, Heatmap representing genes with enriched expression in PBMCs (left) or TRM cells (right). f, Plot showing significantly enriched Gene Ontolology biological processes of genes marking CD8+ and CD4+ TRM cell clusters. Enrichment P value was generated using hypergeometric test with Bonferroni’s multiple-hypothesis correction. g, Images showing migration analysis derived from IIO time-lapse imaging. Tracks are shown in cyan, immune cells in red. Data quantified in h. h, Comparison of TRM cell and blood-derived T cell shape (top) and speed (bottom) from 42 min time-lapse imaging of IIO and organoid + T cell cultures. Two-tailed Mann–Whitney test. Each dot represents a detected cell and is the collation of duplicate cultures from one representative experiment. Cell shape eccentricity, n = 471 for gut TRM cells and n = 593 for blood T cells; motility, n = 2,335 for gut TRM cells and n = 866 for blood T cells. Similar results were observed with three biological replicates. Scale bar, 100 µm.

