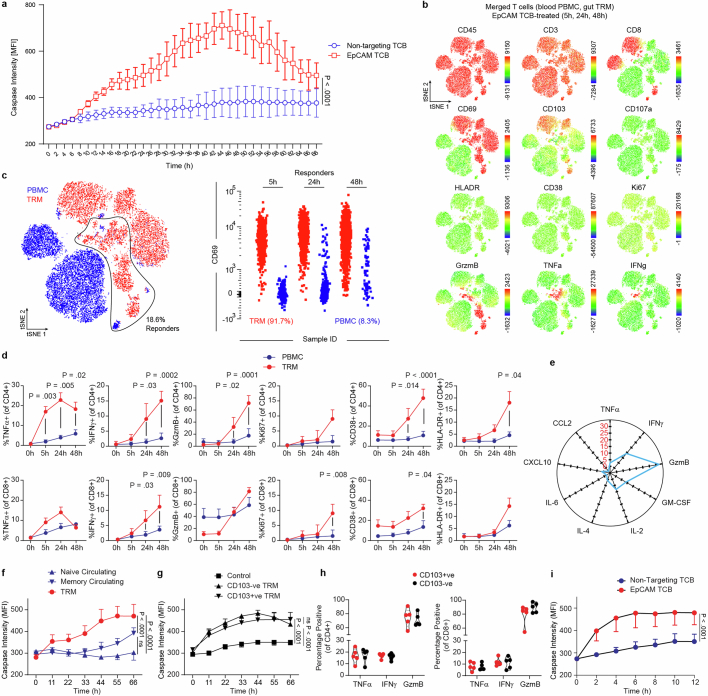
Extended Data Fig. 3. TRMs exhibit rapid and aggressive targeting of healthy epithelium following EpCAM-TCB treatment.
a, Bihourly quantification of caspase 3/7 signal in IIO co-cultures for 68 h treated with either 5 ng/ml EpCAM TCB or a non-targeting control molecule, IIO triplicates representative of 3 independent biological replicates, mean ± SD. Two-tailed unpaired T-test of the area under the curve for each condition. b, Flow cytometry-generated tSNE analysis of all T cells at all timepoints, derived from one representative IIO co-culture and its matched PBMC-organoid co-culture control, treated with 5 ng/ml EpCAM TCB. Plots display heatmaps for each of the 12 surface and intracellular markers assessed by flow cytometry. c, Gating strategy for identifying responder cells (those that expressed TNF-α, IFNγ or GzmB), and the ungating of the concatenated flow cytometry files to reveal the original source of responder T cells. d, Expression of key soluble and cell surface factors in matched TRM and PBMC CD4+ (top row) and CD8+ (bottom row) T cells over 48 h, following IIO or matched PBMC-organoid co-culture treatment with 5 ng/ml EpCAM TCB, as determined via flow cytometry. Mean and SEM, 5 biological replicates (4 for Ki67). Statistically significant values between TRM and PBMC condition at each timepoint are displayed, 2-way ANOVA with Tukey’s Multiple Comparisons Test. e, Cytokine fold-increase in IIO culture supernatants 48 h after 5 ng/mL EpCAM TCB treatment, relative to the matched PBMC-organoid co-culture control, as analysed via Luminex technology. Mean of 3 biological replicates. f, Quantification of caspase 3/7 signal in IIO co-cultures, versus matched organoid-PBMC co-cultures containing either circulating naive and memory T cells for 66 h treated with 5 ng/ml EpCAM TCB, culture quadruplicates representative of 3 independent biological replicates, mean and SD. One-way ANOVA of the area under the curve calculated for each condition. g, Quantification of caspase 3/7 signal in IIO co-cultures containing matched CD103+ and CD103- TRMs for 66 h treated with 5 ng/ml EpCAM TCB or a non-targeting TCB, IIO quadruplicates (triplicates for CD103-ve TRM) representative of 3 independent biological replicates, mean and SD. One-way ANOVA of the area under the curve calculated for each condition. h, Flow cytometry assessment of TNF-α (24 h), IFNγ (48 h) or GzmB (48 h) in CD103+ and CD103- CD4+ T cells (left graph) and CD8+ T cells (right graph) from unsorted IIO cultures after treatment with 5 ng/ml EpCAM TCB. Violin plots collate data from 5 biological replicates. i, Quantification of caspase 3/7 signal in 10-day old IIO co-cultures treated with 5 ng/ml EpCAM TCB or a non-targeting TCB, IIO triplicates (non-targeting) or quadruplicates (EpCAM TCB) representative of 2 biological-independent replicates, mean and SD. Two-tailed unpaired T-test of the area under the curve calculated for each condition.

