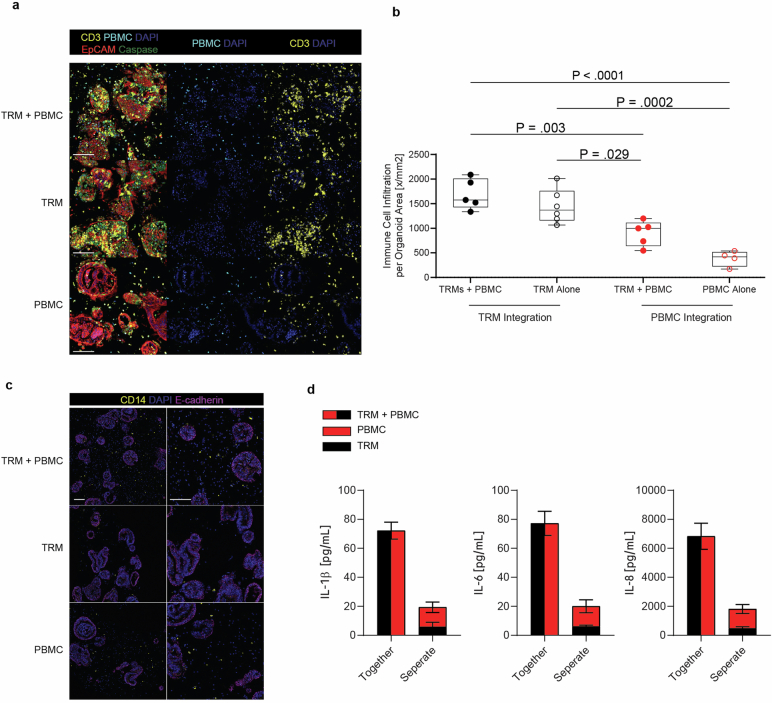
Extended Data Fig. 4. TRM-generated inflammation promotes recruitment of circulating T cells into the epithelium.
a, mIF images of TRM + PBMC (IIO + PBMC), TRM-alone (IIO) and PBMC-alone co-cultures with intestinal organoids, 18 h post treatment with 100 ng/ml EpCAM TCB treatment. EpCAM+ organoids (red) surrounded by CD3+ TRMs (yellow) and CellTracker CMFDA Green+ CD3+ PBMCs (cyan+yellow). Caspase 3 (green) captures TCB-triggered immune-induced apoptosis, nuclei are stained with DAPI (blue). Scale bar, 100 µm. Images are representative of four independent IIO experiments. b, Immune infiltration of TRMs, PBMC and TRMs+PBMC-organoid into organoids at 30 h post EpCAM TCB treatment. Data represented as boxplots, with whiskers showing all points (minimum to maximum) of the mean number of immune cells per individual organoid, summed and normalized to the sum organoid area for 4 (PBMC alone), 5 (TRM + PBMC) or 6 (TRM alone) independent IIO replicates. One-way ANOVA with Tukey’s multiple comparisons test. c, mIF images of TRM + PBMC, TRM-alone and PBMC-alone co-cultures with intestinal organoids following 4 h treatment with 100 ng/ml EpCAM TCB. Monocytes (yellow) surround organoids (pink), nuclei are stained with DAPI (blue). Scale bar, 100 µm. Images are representative of four independent IIO experiments. d, Luminex quantification of IL-1β, IL-6 and IL-8 in the supernatants of the TRM + PBMC co-culture with organoids and the respective single immune cell condition, 30 h after treatment with 100 ng/ml EpCAM, 3 independent IIO replicates, representative of 3 biologically independent experiments. Mean and SD.

