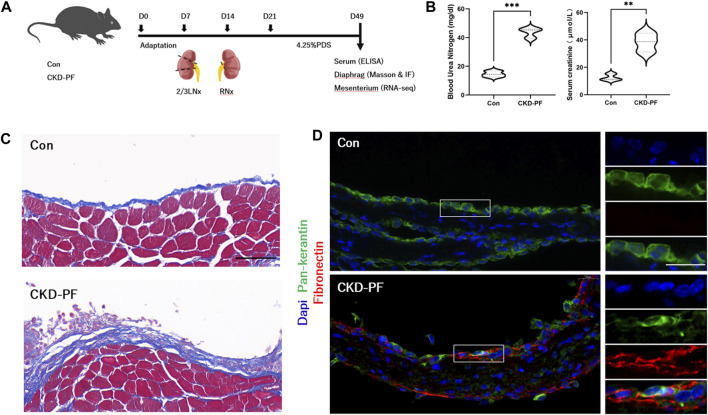
FIGURE 1.
Construction of CKD-PF mice models. (A) Flow chart of the animal experiment. (B) Detection of mice renal function by ELISA. The data are expressed as mean ± SEM; **P < 0.01, ***P < 0.001 vs. the CKD-PF group, Student’s t-test. (C) Masson staining was utilized to detect pathological changes in the diaphragms of mice. Scale bar: 50 μm. (D) Immunofluorescence staining showing the FN expression in the diaphragms of mice. Scale bar: 20 μm. Blue (Dapi, nucleus), Green (Pan-keratin, mesothelial cells), Red (FN, fibrosis).

