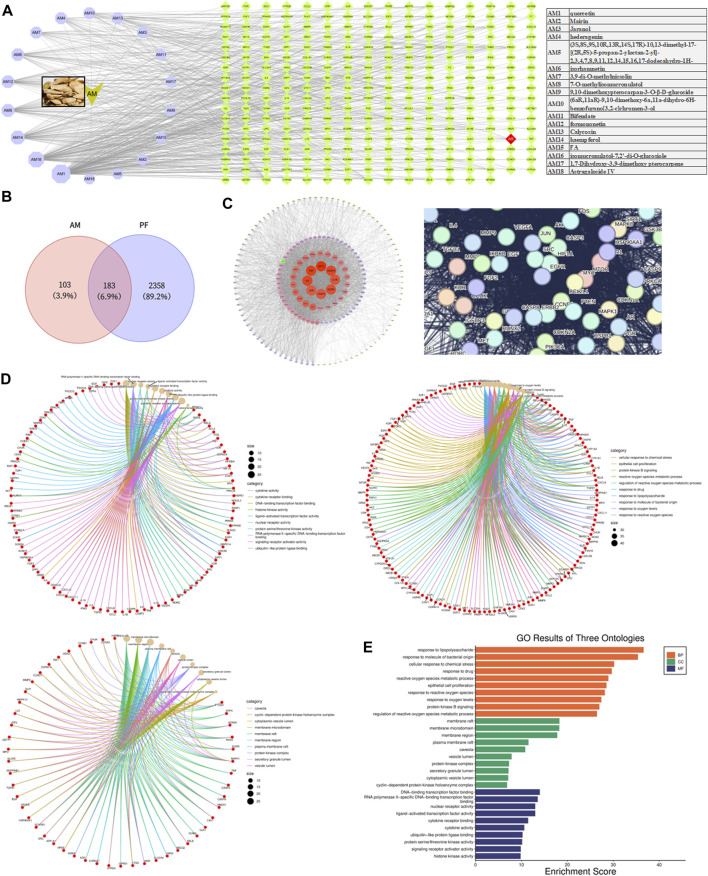
FIGURE 3.
Network pharmacology analysis of AM and PF. (A) Components of AM and targets of these components. (B) Venn diagram showing common targets of AM and PF. (C) Top targets based on PPI network and interactions speculated by the String database. (D,E) GO analysis of common target between Calycosin and PF.

