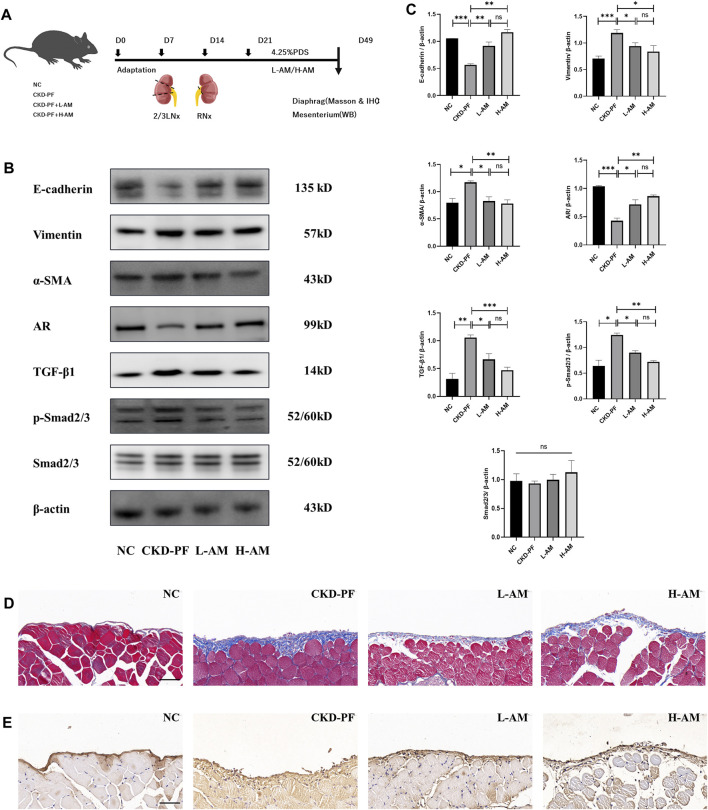
FIGURE 4.
Effects of AM on PF. (A) Flow chart of animal experiment. (B,C) Expression of E-cadherin, Vimentin, α-SMA, AR, TGF-β1, p-Smad2/3, and Smad2/3 of the mesenterium in each group tested by western blot analysis. The data are expressed as mean ± SEM; *P < 0.05, **P < 0.01, ***P < 0.001 vs. the CKD-PF group, Student’s t-test. (D) Masson staining was utilized to detect pathological changes in the diaphragms of mice. Scale bar: 50 μm. (E) IHC staining was utilized to detect FN levels in the diaphragms of mice. Scale bar: 50 μm.

