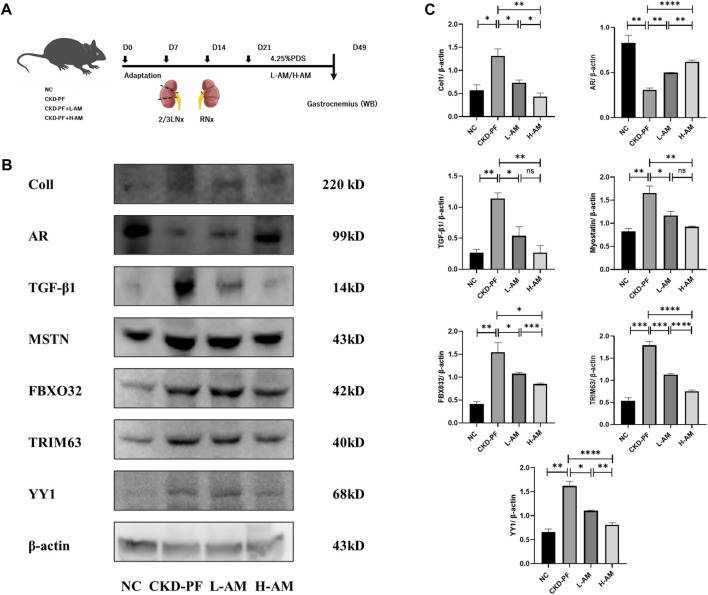
FIGURE 5.
Effects of AM on muscle atrophy. (A) Flow chart of animal experiment. (B,C) Expression of Coll, AR, TGF-β1, MSTN, FBXO32, TRIM63, and YY1 of the gastrocnemius muscle in each group tested by western blot analysis. The data are expressed as mean ± SEM; *P < 0.05, **P < 0.01, ***P < 0.001, ****P < 0.001 vs. the CKD-PF group, Student’s t-test.

