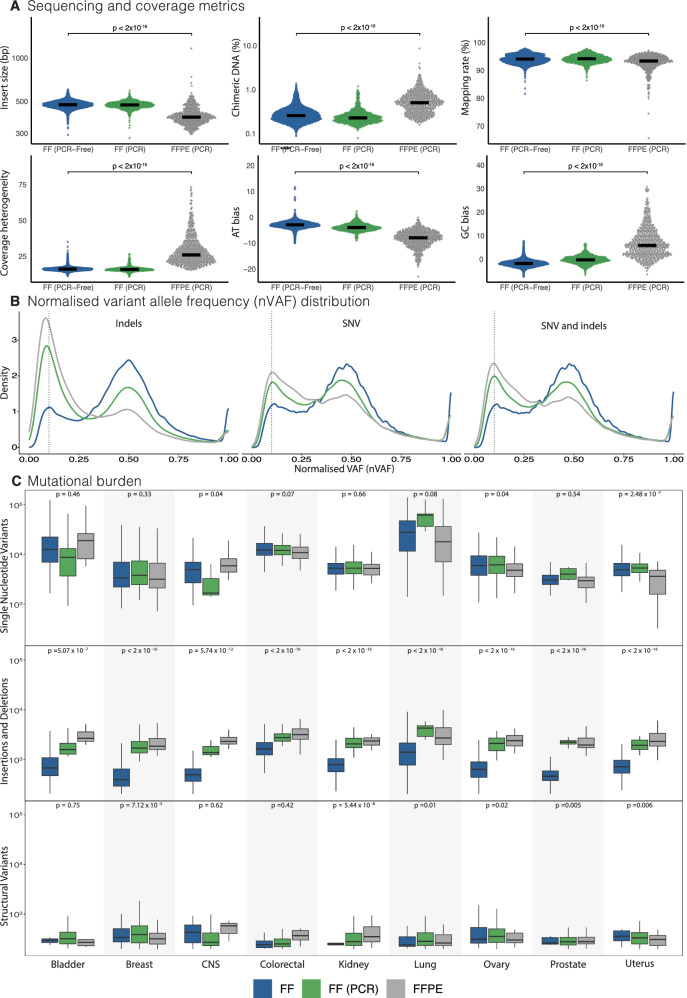
Fig. 1. Quality of sequencing data in Genomics England Cohort.
A Comparison of sequencing and coverage metrics between FF (n = 10,115), FF(PCR) (n = 899), and FFPE(PCR) (n = 578). Insert sizes represent lengths of sequenced DNA fragments. Chimeric DNA percentage is the proportion of reads synthesised from more than one template. Mapping rate is the percentage of reads that can be mapped to the reference genome. Coverage heterogeneity is the read depth uniformity across the genome. Adenosine/thymine (AT) and guanine/cytosine (GC) bias indicates the percentage of reads that are under or overrepresented in AT-rich or GC-rich genomic regions. The p-values indicate statistical comparisons between FF and FFPE cohorts using a two-sided Wilcoxon rank-sum test. B Normalised variant allele frequency distribution. Variant allele fraction (VAF) is the proportion of sequencing reads reporting a specific variant, whilst cancer cell content is the estimated percentage of tumour cells in the sample. The dotted vertical line is located at VAF 0.1 for reference. C Comparison of single nucleotide variant, indel, and structural variant mutational burdens across organ types. Bladder (FF n = 359, FF PCR n = 31, FFPE n = 10), Breast (FF n = 2509, FF PCR n = 283, FFPE n = 169), CNS (FF n = 504, FF PCR n = 76, FFPE n = 17), Colorectal (FF n = 2469, FF PCR n = 113, FFPE n = 88), Kidney (FF n = 1355, FF PCR n = 95, FFPE n = 30), Lung (FF n = 1290, FF PCR n = 114, FFPE n = 64), Ovary (FF n = 527, FF PCR n = 60, FFPE n = 34), Prostate (FF n = 384, FF PCR n = 84, FFPE n = 98), Uterus (FF n = 718, FF PCR n = 43, FFPE n = 68). The box and whisker plots in this figure are defined as follows: the centre line represents the median, the bounds of the box indicate the lower (25th percentile) and upper (75th percentile) quartiles and the whiskers extend to the minimum and maximum values. The p-values indicate statistical comparisons between FF and FFPE cohorts using a two-sided Wilcoxon rank-sum test. FF fresh frozen, FF (PCR) fresh frozen with polymerase chain reaction, FFPE formalin-fixed paraffin-embedded.

