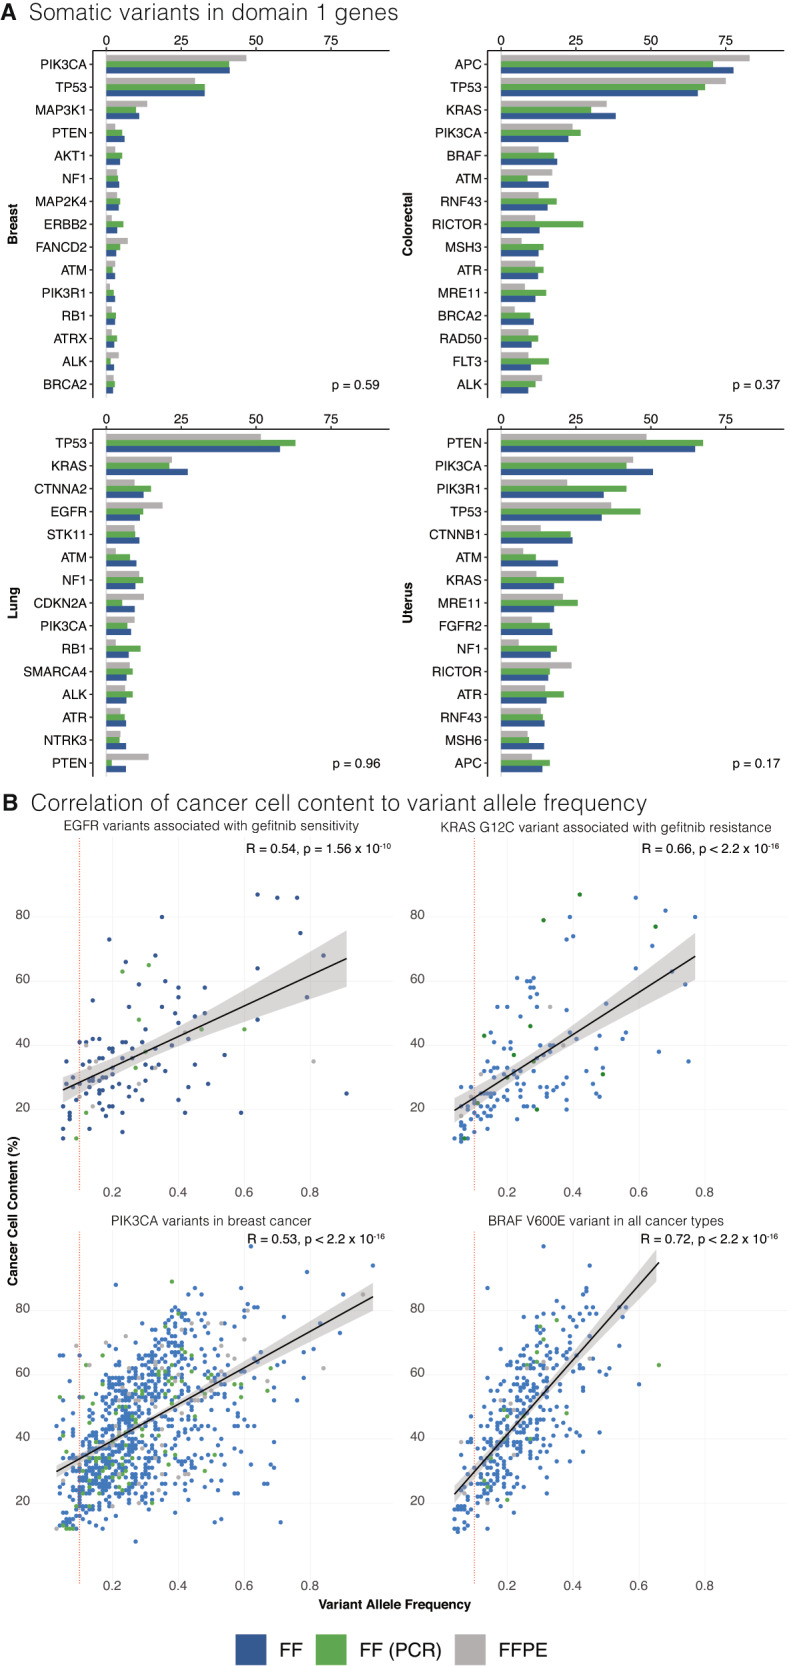
Fig. 2. Comparison of putative driver events in Genomics England Cohort.

A Comparison of detection of Domain 1 variants across different sample preparations (reported as a percentage of samples). Additional organ types are presented in the supplementary information. Kruskal–Wallis rank sum test was used for statistical analysis. B Comparison of percentage cancer cell content to variant allele frequency for selected actionable mutations. The solid black line represents the linear regression fit, and the shaded area around the line indicates the 95% confidence interval of the fit. A vertical red dotted line is demonstrated at variant allele frequency 0.1 to demonstrate that a significant number of mutations would be discarded if conventional bioinformatic filtering was applied. Top left panel plots EGFR variants associated with gefitinib sensitivity in lung cancer. Top right panel plots the KRAS G12C variant associated with gefitinib resistance in lung cancer. Bottom right panel plots PIK3CA variants in breast cancer and the bottom left panel plots BRAF V600E variant in all cancer groups included in the study. Correlation was assessed using Spearman’s Rank Correlation (two-sided test). FF fresh frozen, FF (PCR) fresh frozen with polymerase chain reaction, FFPE formalin fixed paraffin embedded.
