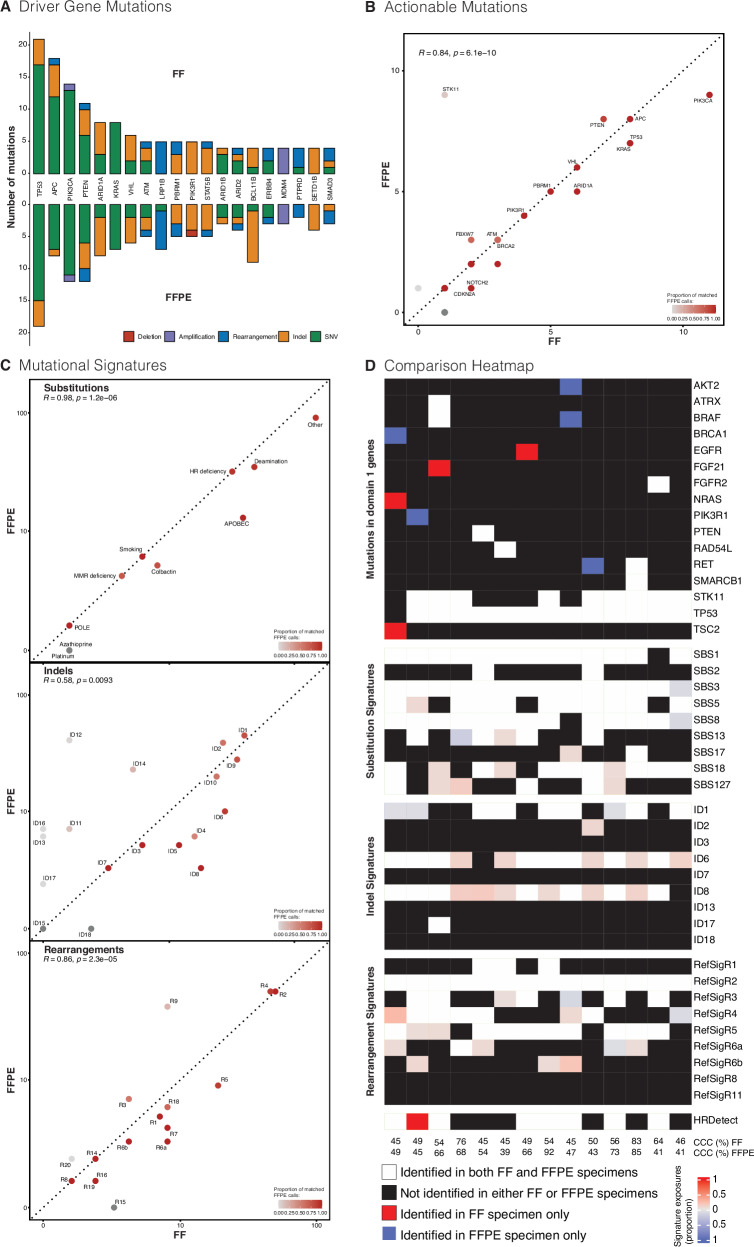
Fig. 5. Comparison of two validation cohorts with matched FFPE and FF specimens.
A Comparison of count and class of driver gene mutations in the Oxford Cohort (n = 51) (supporting data Table S11). Concordance in calling of B actionable variants (supporting data Table S12) and C mutational signatures between FFPE and FF specimen in the Oxford Cohort. Dotted line represents 100% concordance (R = 1), and the colour of the points demonstrates the proportion of FFPE calls that are complementary to the matched FF specimen. A log-scale is used for mutational signatures. D Heatmap comparing genomic characteristics in the PARTNER/PBCP Cohort (n = 14). The top 20 mutated Domain 1 genes are presented. Common breast signatures are presented for substitution and rearrangement, whilst only indel signatures with proposed aetiology are presented. HRDetect is again calculated following correction for indel artefact as discussed in the “Methods” section and supplementary information. Cancer cell content (CCC) is provided for both FF and FFPE samples. Correlation was assessed using Spearman’s Rank Correlation. FF fresh frozen, FFPE formalin fixed paraffin embedded.

