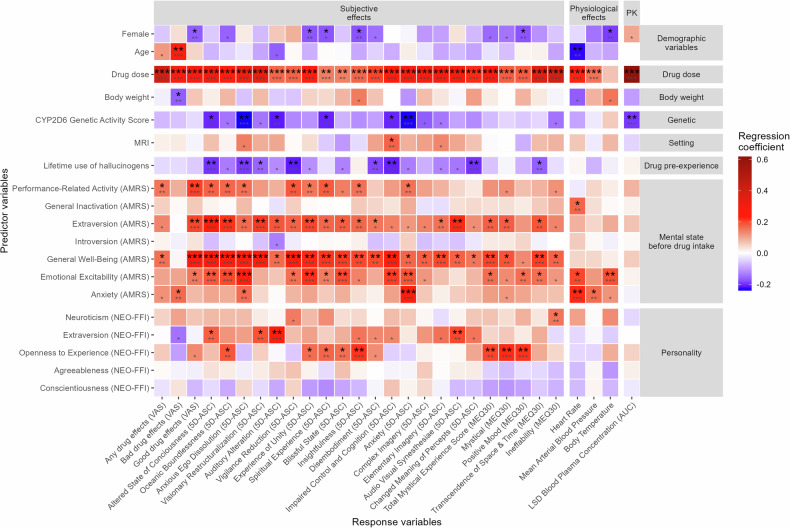
Fig. 1. Standardized regression coefficients and statistical significance of each predictor variable in the linear mixed effects models adjusting for drug dose (except drug dose).
The data used are the difference between the LSD and the respective placebo session. Smaller asterisks show the uncorrected statistical significance. Bigger asterisks show the significance after correction for multiple testing across all 19 * 29 = 551 significance tests using the Benjamini-Hochberg procedure [41]. *p < 0.05, **p < 0.01, ***p < 0.001. N = 297. The peak effect was used for the physiological effects. CYP cytochrome P450, MRI magnetic resonance imaging, VAS visual analog scale (area under the effect-time curve 0–11.5 h), AMRS adjective mood rating scale, NEO-FFI NEO five-factor inventory, 5D-ASC five dimensional altered states of consciousness, MEQ30 30-item mystical effects questionnaire, AUC area under the curve from 0–∞h. Detailed statistical estimates are listed in Supplementary Table S4.

