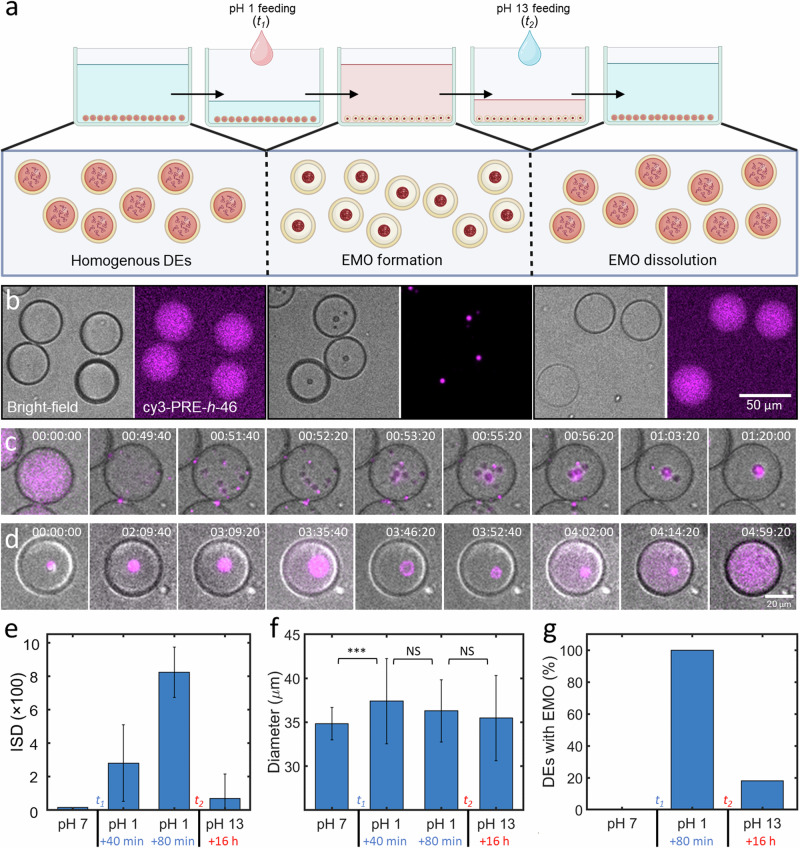
Fig. 2. Reversible pH-triggered EMO formation in DEs.
a Schematic of the experimental cycle induced by pH changes leading to EMO formation and dissolution within a PDMS well; t1 and t2 correspond to the time points of adding pH 1 feed and pH 13 feed respectively. b Representative bright-field and fluorescence images of DEs across three conditions: pre-pH shock (left), pH 1 bath (middle), and pH 13 bath (right). c, d Time-lapse (bright-field and fluorescence merged) of EMO formation (c) and dissolution (d) within a single DE monitored over >6 h. The contrast has been adjusted for individual images for better visualization. e Mean ISD values of the DE population at different time points over a period of 20 h showing clear correlation with EMO formation and dissolution. f Mean diameter of DEs at different trigger points showing a significant difference (marked by asterisks; p-value < 0.001) after adding the acidic feed, while no significant difference (marked NS) was observed later on. g A plot showing the percentage of DEs containing EMOs after different triggers. Data points represent mean values derived from at least 83 DEs for each measurement, with error bars indicating standard deviations. The inner aqueous phase contained 25 µM PRE-h-46 (with 4 mol% cy3-PRE-h-46 for fluorescence visualization).

