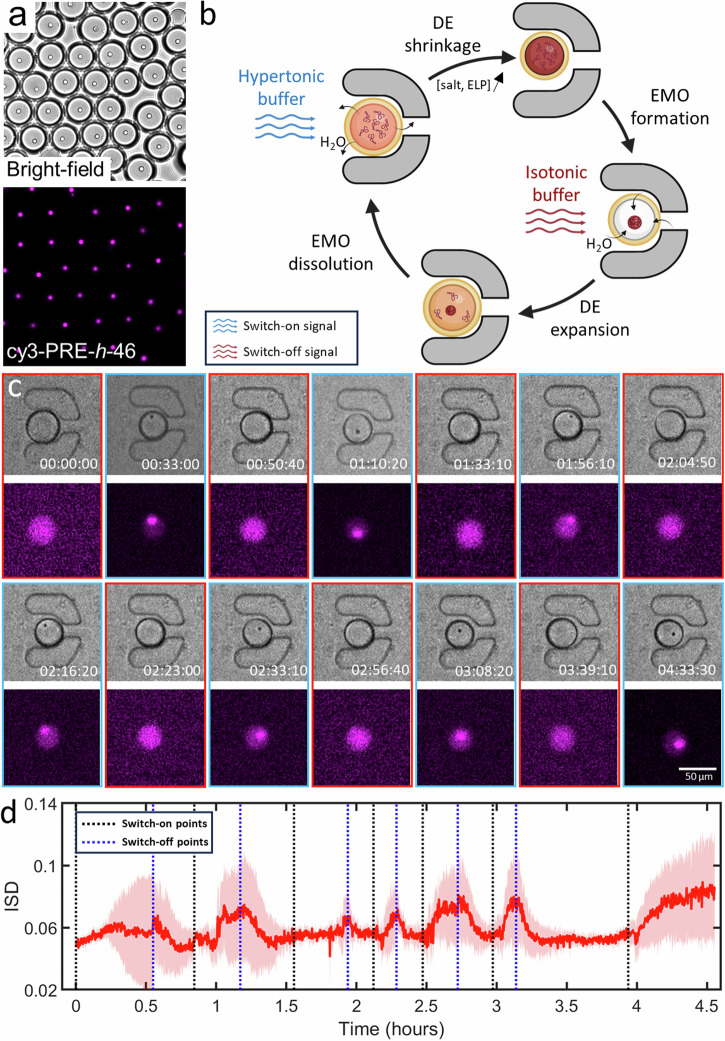
Fig. 5. Changes in osmotic strength of the external environment leads to reversible EMO formation in DEs trapped on-chip.
a Triggering coacervation via osmolarity change led to a single, uniform-sized EMO in each DE as visualized in both bright-field and fluorescence. b Illustrative representation of the cycle induced by concentration changes leading to EMO formation and dissolution within microfluidics. The process involves entrapment of the DE, followed by a hypertonic shock, leading to DE shrinkage and subsequent EMO formation as a result of increase in salts and ELP concentration. Subsequent introduction of an isotonic solution reverses this process, thereby dissolving the EMO. c Time-lapse bright-field and fluorescence images showing the dynamic process of EMO formation and dissolution in response to repeated hyperosmotic shocks within a trapped DE. d Change of the mean ISD of DEs (n 13) over a period of 4.5 h. The pink shaded area indicates the standard deviation of the ISD values. Black and blue dotted lines show approximate introduction times of the hypertonic and isotonic solutions respectively. The inner aqueous phase contained 25 µM PRE-h-46 (with 4 mol% cy3-PRE-h-46 for fluorescence visualization).

