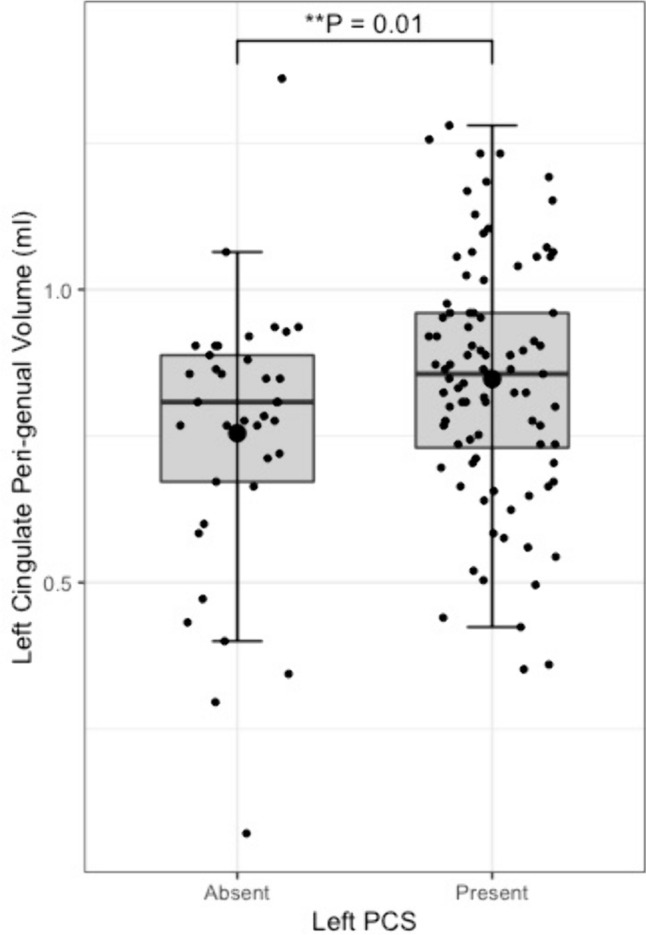
Fig. 7.

Peri-genual cingulum bundle tract volume by left paracingulate sulcal presence. Box plot displaying left peri-genual cingulum [Xtract] tract volume by left Paracingulate sulcal presence. Black dots represent individuals, n = 125. Thick horizontal black lines represent group median values. Larger black dots represent group mean values. Boxes extend from the 25th to the 75.th percentile, horizontal black lines within the boxes denote median values. P-values (P) of general linear models corrected for age, sex and handedness are displayed over the box plots. * Significance at P = < 0.05. ** P = < 0.01
