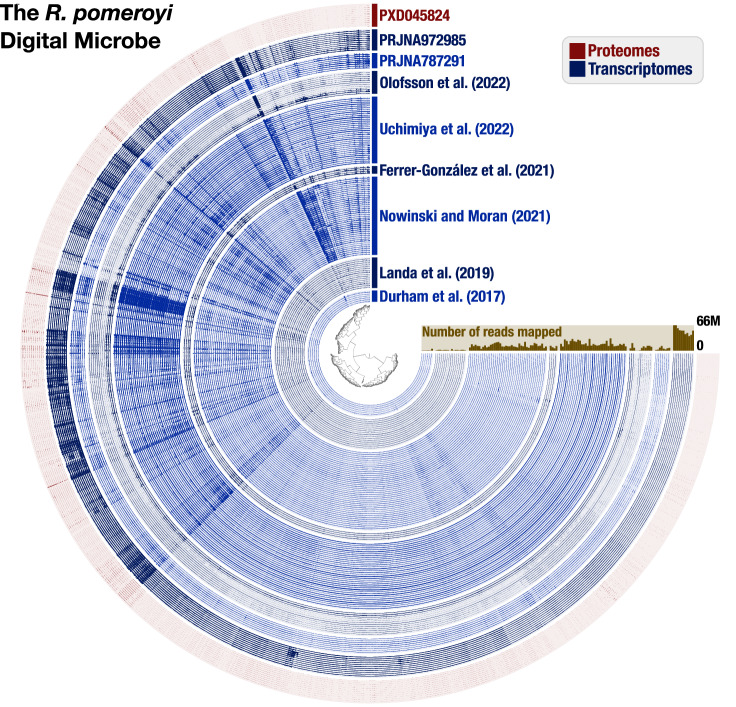
Fig. 3.
Contents of the R. pomeroyi Digital Microbe. As visualized in anvi’o ‘gene mode’, each item on the inner tree corresponds to one gene call in the R. pomeroyi genome, and the blue concentric circles display the coverage of each gene in a given transcriptome sample. The outermost red concentric circles correspond to normalized protein abundances from proteome samples (raw files available in the Proteomics Identifications Database (PRIDE) via Project PXD045824). Samples are grouped by their study of origin, with the data source indicated in text of the same color as the samples. The brown bar plot indicates the total number of reads that mapped from each transcriptome to the R. pomeroyi genome. This figure was generated from version 5.0 of the R. pomeroyi Digital Microbe databases on Zenodo.

