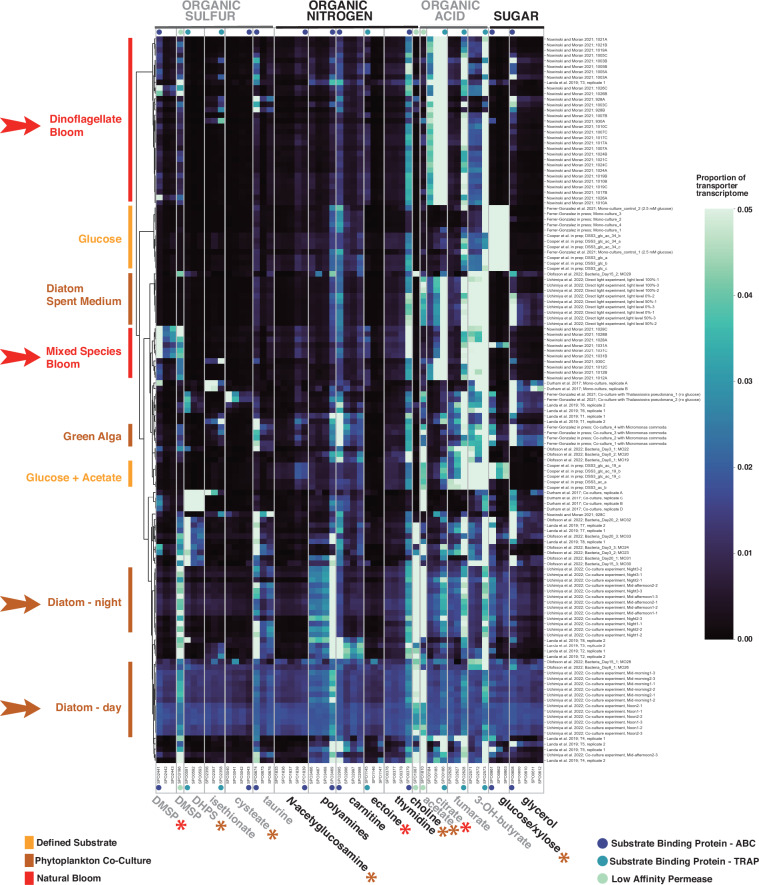
Fig. 4.
Clustered heatmap of relative gene expression for 18 experimentally annotated R. pomeroyi transporters compiled in a Digital Microbe. Each row represents a single transcriptome from the Digital Microbe dataset, and each column represents all transporter proteins with experimentally confirmed cognate substrates. Row labels indicate study and sample name (Table S1). Brighter colors indicate higher proportional expression (the scale maximum is ≥5% of the sum of the 18 transporter transcriptomes) while darker colors indicate lower. Arrows point out transcriptomes collected when substrates were derived from dinoflagellate-rich natural communities (red) or diatom co-cultures (brown); significant differences in transporter protein expression between these two substrate sources are indicated with asterisks colored red (enriched with dinoflagellates) or brown (with diatoms) (T-test, p ≤ 0.05).

