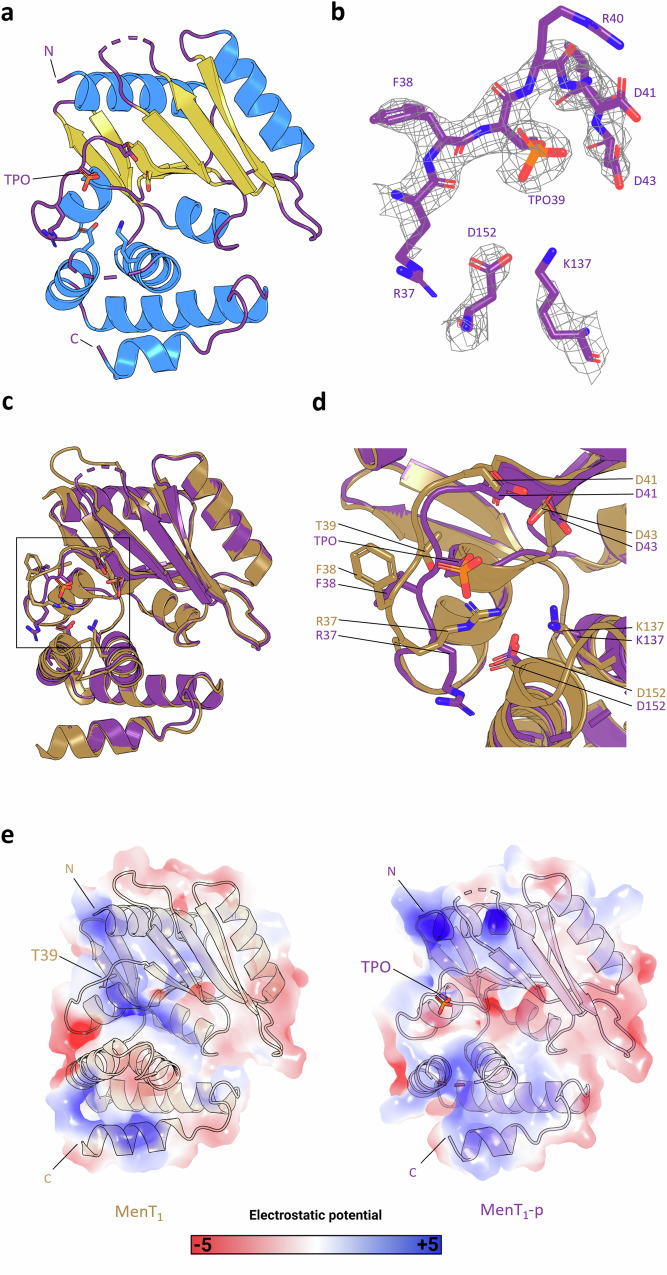
Fig. 3. MenT1 T39 phosphorylation reduces the net positive charge within the NTase active site.
a Crystal structure of monomeric MenT1-p (PDB 8RR5) shown as a cartoon and coloured by secondary structure elements. N and C termini are indicated. b 2Fo-Fc electron density map of phosphorylated MenT1 during structural refinement. c Structural alignment of MenT1 (sand) and MenT1-p (purple) protein backbones, RMSD 0.410 Å across 160 atoms. d Close-up view of the boxed region of (c), rotated 45 degrees around the z-axis. Residues of interest are shown as sticks coloured red for oxygen, blue for nitrogen, and orange for phosphorus. e Surface electrostatics of MenT1 and MenT1-p, viewed as in (a), depicting electrostatic potential from −5 kBTe−1 (red) to +5 kBTe−1 (blue), where e is the electron, T is temperature and kB is the Boltzmann constant. Electrostatics were generated using default settings for the APBS plugin (PyMol).

