FIGURE 4.

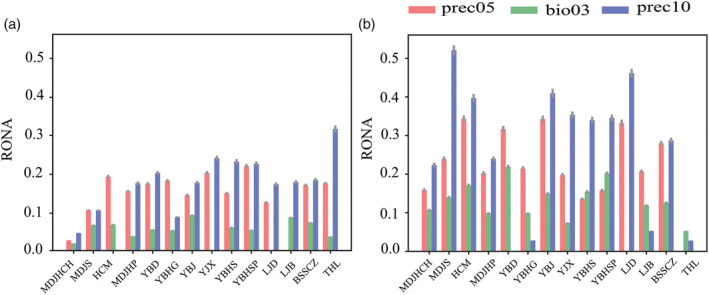
RONA of Taxus cuspidata under RCP 2.6 (a) and RCP 8.5 (b) prediction models for 2070. Bars represent weighted means (by R 2 value), and grey error bars represent the standard error.

RONA of Taxus cuspidata under RCP 2.6 (a) and RCP 8.5 (b) prediction models for 2070. Bars represent weighted means (by R 2 value), and grey error bars represent the standard error.