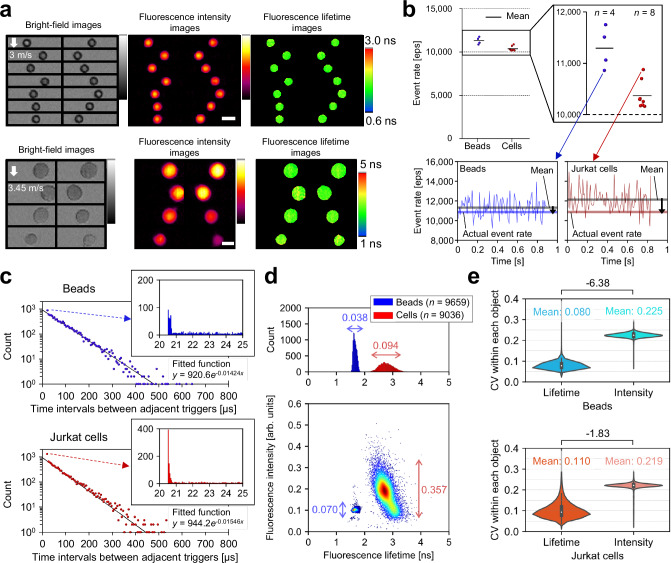
Fig. 2. Demonstration of FLIM flow cytometry at over 10,000 eps.
The panels (a, line graphs in b, c–e) were generated from one of the image acquisition trials of 10,000 consecutively triggered events, from which 6-μm fluorescent beads (n = 9659) and Jurkat cells (n = 9036) were extracted (Supplementary Fig. 3). a, Representative images of 6-μm beads obtained at 10,862 eps and of Jurkat cells stained with Calcein-AM obtained at 10,877 eps. Scale bars: 10 μm. b Demonstrated event rates. The line graphs show the relationship between the instantaneous (per 100 events), mean, and actual event rates calculated from 10,000 event acquisitions. n represents the number of image acquisition trials conducted. c Distributions of time intervals (n = 9999) between adjacent trigger events for beads (top, blue) and cells (bottom, red). Each dot in the scatter plots represents the total number of time intervals within every 5 μs as the vertical value and their average as the horizontal value. Histograms show the details of the dots representing 20–25 μs time intervals. Solid lines are exponential fits to the dots based on the least absolute residuals. d Distributions of beads and cells in fluorescence intensity and fluorescence lifetime. The double-headed arrows indicate the coefficient of variations (CVs) for fluorescence intensity and fluorescence lifetime. e Distributions of beads (n = 9659) and cells (n = 9036) in the CVs of fluorescence intensity and fluorescence lifetime pixels within each object. Difference values between two samples represent effect sizes (Cohen’s d), with their standard errors less than 0.04. The violin plots display the median values with white dots, the first and third quartiles with box edges, and 1.5 times the interquartile range (IQR) with whiskers. Source data are provided as a Source Data file.

