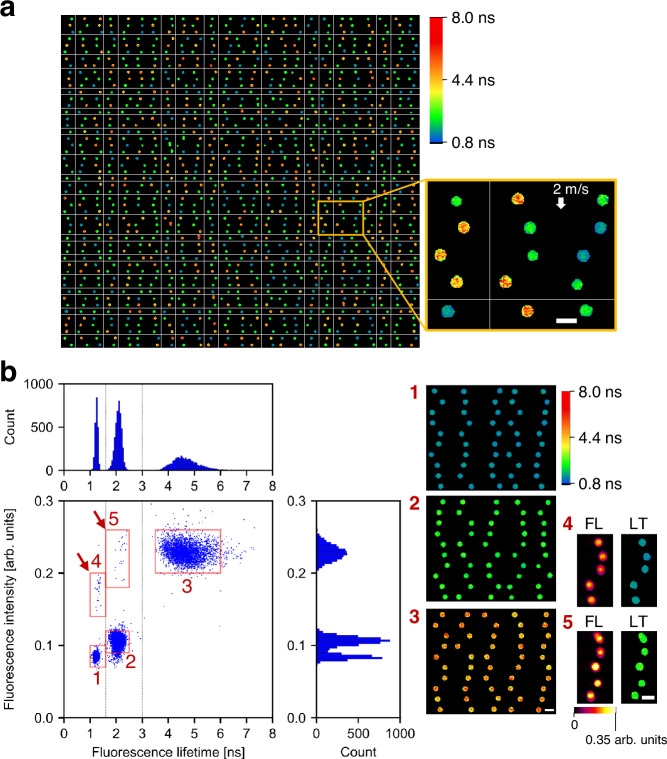
Fig. 3. Differentiation of inter-object fluorescence lifetime components by FLIM flow cytometry.
Scale bars: 10 μm. a Representative fluorescence lifetime images (50 rows × 25 columns) obtained from a mixture of 6.5-μm polymer beads with fluorescence lifetime values of 1.7 ns, 2.7 ns, and 5.5 ns. The flow speed was 2 m/s. Two independent experiments were performed, resulting in similar results. b Distributions of the fluorescent beads (n = 9945). Dashed lines represent 1.6 ns and 3.0 ns. The right images show the beads randomly picked from the corresponding red boxes in the scatter plot. FL fluorescence intensity, LT fluorescence lifetime. Source data are provided as a Source Data file.

