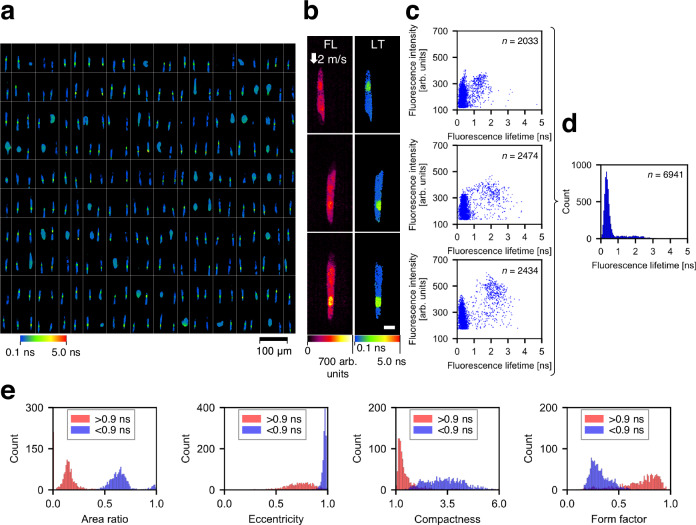
Fig. 4. Differentiation of intra-object fluorescence lifetime components by FLIM flow cytometry.
a Representative fluorescence lifetime images (10 rows × 25 columns) of E. gracilis cells stained with SYTO16 and flowing at 2 m/s. The images were segmented by a specific threshold value of fluorescence intensity (160 arb. units). Only E. gracilis cells with elongated shapes (eccentricity > 0.95) were used for subsequent analyses (b–e). b Representative images of E. gracilis cells with an eccentricity of >0.95, which includes images in Fig. 1e. FL fluorescence intensity, LT fluorescence lifetime. Scale bar: 10 μm. Two independent experiments were performed, resulting in similar results for panels a and b. c Scatter plots showing pixel distributions in fluorescence intensity and fluorescence lifetime corresponding to the images in panel b. n represents the number of image pixels. d Histogram of the pixel values from the fluorescence lifetime images in panel b. n represents the number of image pixels. e Representative morphological features of objects occupied with <0.9-ns pixels (blue, n = 1290) and with >0.9-ns pixels (red, n = 1079). The area ratio is defined as the ratio of an object area with <0.9 ns or > 0.9 ns to the entire cell area. Source data are provided as a Source Data file.

