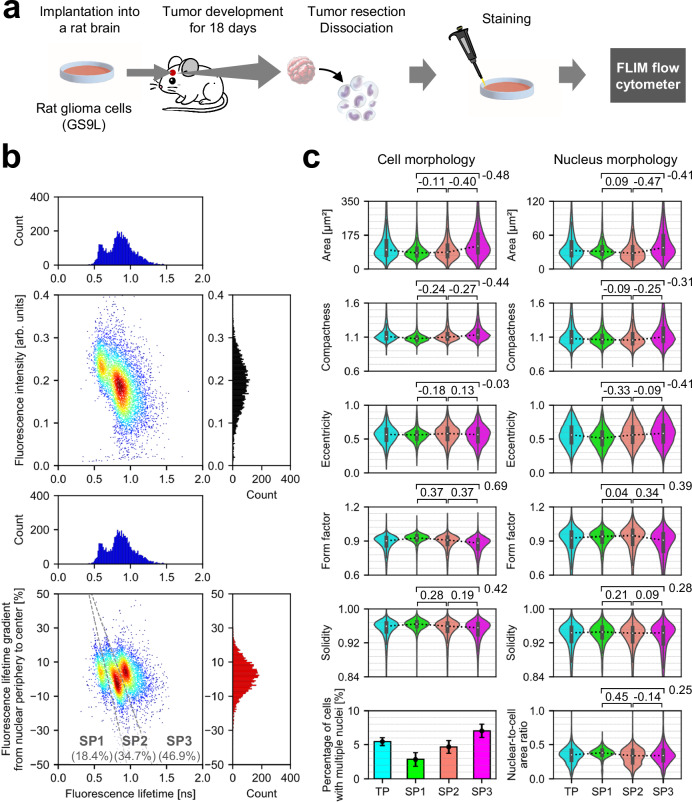
Fig. 5. Investigation of cellular heterogeneity in rat glioma with FLIM flow cytometry.
a Experimental procedure. b Distributions of tumor-derived rat glioma cells in fluorescence intensity (black histogram), fluorescence lifetime (blue histogram), and fluorescence lifetime gradient from nuclear periphery to center (red histogram). SP: subpopulation. n = 5732. c Comparison of subpopulations in morphological features of cells and their nuclei. TP: total population. Values between two samples represent effect sizes (Cohen’s d), with their standard errors <0.04. The violin plots display the median values with white dots, the first and third quartiles with box edges, and 1.5 times the IQR with whiskers. For the violin plots, the sample sizes are as follows: TP: n = 5732; SP1: n = 1054; SP2: n = 1991; SP3: n = 2687. The bar plot illustrates the percentage of cells with multiple nuclei calculated for each cell population, accompanied by the upper and lower bounds of its 95% confidence interval. Source data are provided as a Source Data file.

