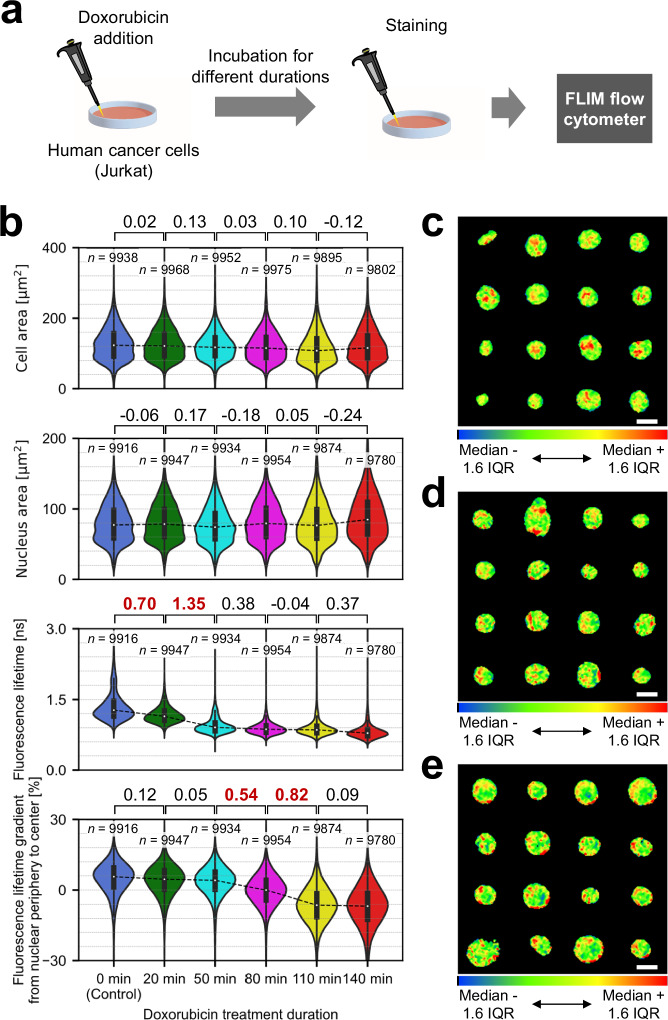
Fig. 6. Large-scale analysis of drug-induced temporal nucleus dynamics with FLIM flow cytometry.
a Experimental procedure. b Comparison of temporal evolution data in cell area, nucleus area, fluorescence lifetime, and fluorescence lifetime gradient from nuclear periphery to center. Values between two samples represent effect sizes (Cohen’s d), with their standard errors <0.02. Effect sizes with absolute values exceeding 0.5 are highlighted in bold and red. The violin plots display the median values with white dots, the first and third quartiles with box edges, and 1.5 times the IQR with whiskers. c-e, Examples of standardized fluorescence lifetime images of Jurkat cells treated with doxorubicin for 0 min (c), 80 min (d), and 140 min (e), and stained with SYTO16. The standardization was performed by adjusting the color scale to the range of median ±1.6IQR of fluorescence lifetime pixel values from each nucleus, after compensating for the fluorescence lifetime slope across a field of view and applying a 3 × 3 median filter. Each image set shows the following fluorescence lifetime gradient from nuclear periphery to center (c: 12%, d: 0%, e: −12%, to a tolerance of ±0.1%). Scale bars: 10 μm. Two independent experiments were performed, resulting in similar results. Source data are provided as a Source Data file.

