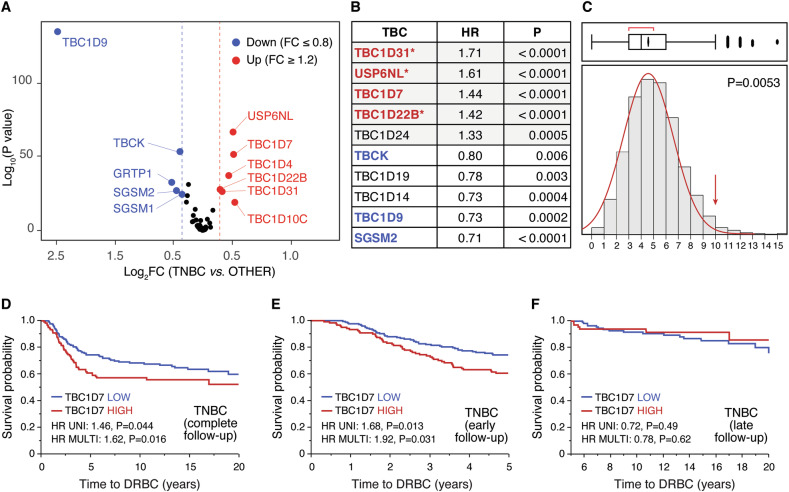
Fig. 1. Analysis of TBC1D genes in the METABRIC dataset (N = 1904 cases).
A For each individual TBC1D gene the level of expression in the TNBCs of the METABRIC dataset (N = 299 TNBCs) vs. all other molecular subtypes (N = 1605 cases) was calculated as FC (fold change in TNBCs/non-TNBCs). Results in the Volcano plot are expressed as log2 FC vs. log10 P values. Cut-off values for overexpression (FC ≥ 1.2, red circles) or underexpression (FC ≤ 0.8, blue circles) are indicated by dashed red and blue lines, respectively. Significance threshold was set at P < 0.05. The fold change (FC) was determined based on the mean expression of each TBCs in TNCB versus all other samples. All p-values were derived with the non-parametric Wilcoxon test using JMP version 14.3. The complete set of data is in Supplementary Table 1. B TBC1D genes were analyzed for HR (hazard ratio) for death related to BC (DRBC) in univariate analysis. P-values and HR were calculated by Cox proportional hazards regression model analysis using ‘survival’ package in R, version 3.5–5. Only genes displaying HR ≥ 1.2 or ≤ 0.8 at P < 0.01 are shown. Genes associated with worse prognosis are shaded in gray. In red and blue are shown the genes found overexpressed or underexpressed in TNBCs (as per panel A), respectively. Multivariable analysis (variables used for the multivariable analyses were: age, tumor size, nodal status, HR (ER/PGR), HER2, and tumor grade) was also performed, and the genes that remained significant in this type of test are indicated by asterisks. The complete set of data is in Supplementary Table 2. C Montecarlo simulation was performed in R to test the probability of finding ≥10 genes predicting poor prognosis in univariate analysis in random sets of 44 genes, from the 24 368 genes present in the METABRIC dataset. Ten thousand random sets were generated and tested, yielding 53 sets containing ≥10 significant genes. Thus, the probability of random occurrence is 0.0053. D The expression of TBC1D7 was categorized as HIGH or LOW with respect to the mean expression in the TNBC (n = 299) subtype of samples from the METABRIC dataset. Following this categorization, Kaplan–Meier analyses, univariate and multivariable survival analyses were performed within JMP, employing the Survival platform and the Cox proportional hazards model, as appropriate. E, F TNBC samples were probed for survival analysis considering early (0–5 years, E panel) and late (5–20 years, F panel) DRBC. Kaplan-Meier analyses, univariate and multivariable survival analyses were performed as described in D.

