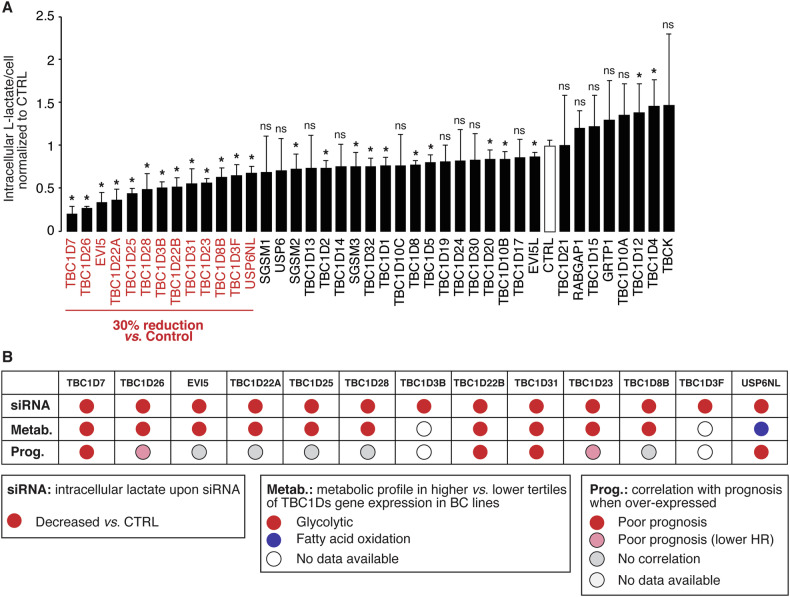
Fig. 3. TBC1D gene expression and lactate production.
A Levels of intracellular L-lactate upon silencing of the indicated TBC1D genes in MDA-MB-468 TNBC cells. Genes whose silencing induced a decrease in lactate production of at least 30% relative to silencing control (CTRL) are indicated in red. Data are expressed as mean ± SD (n = 4). *P < 0.05; ns, not-significant (see also Supplementary Table 8). B The characteristics of the “red” genes in panel A are shown, including the results of the siRNA experiment (panel A), the metabolic profiles (from Fig. 2), and the correlation with prognosis (from Fig. 1B). In the category “Prognosis”, red circles indicate genes strongly correlating with prognosis in univariate analysis (HR ≥ 1.2; P < 0.01, as from Fig. 1B), pink circles indicate genes significantly correlating with prognosis (P < 0.05) but with lower HRs (~1.2, see Supplementary Table 2).

