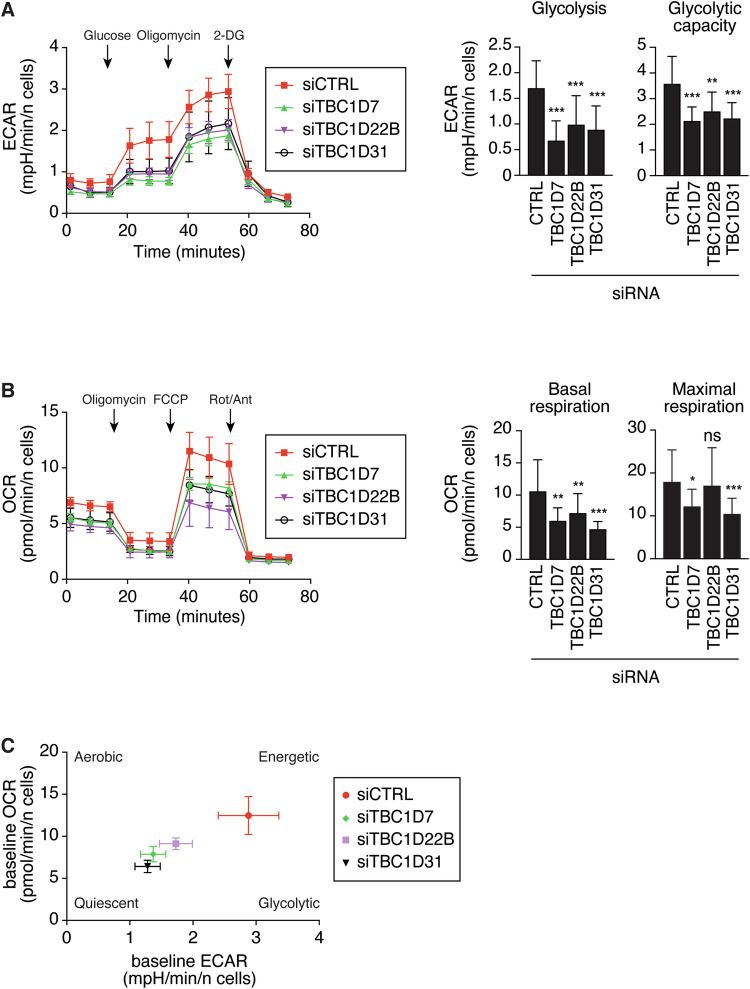
Fig. 4. Seahorse analysis of MDA-MB-468 cells silenced with various TBC1D genes.
A Extracellular acidification rate (ECAR) was measured in MDA-MB-468 silenced with control oligos or siRNAs for TBC1D genes ECAR data were normalized on the number of cells. 2-DG: 2-Deoxy-D-glucose. The shown profiles (left) are representative of 3 independent experiments. Values are the mean ± SD n = 6. The bar graphs (right) report the parameters glycolysis and glycolytic capacity in cells silenced as indicated (data represent mean ± SD of 3 independent experiments, n = 18). B O2 consumption rate (OCR) was measured in MDA-MB-468 silenced with control oligos or siRNAs for TBC1D genes. The shown profiles (left) are representative of 3 independent experiments. OCR data were normalized on the number of cells. FCCP: carbonyl cyanide-4-(trifluoromethoxy)phenylhydrazone, Rot/Ant: rotenone + antimycin. Values are the mean ± SD n = 6. The bar graphs (right) report the parameters basal respiration and maximal respiration in the cells silenced as on bottom (data represent mean ± SD of 3 independent experiments, n = 18). In A, B, *P < 0.05; **P < 0.01; ***P < 0.001; ns not-significant. C Energy map. Relative baseline ECAR and OCR data were plotted simultaneously to reveal overall relative metabolic profiles of MDA-MB-468 cells, variously silenced as indicated in the legend on the right. Data represent mean ± sem of 3 independent experiments, n = 18.

