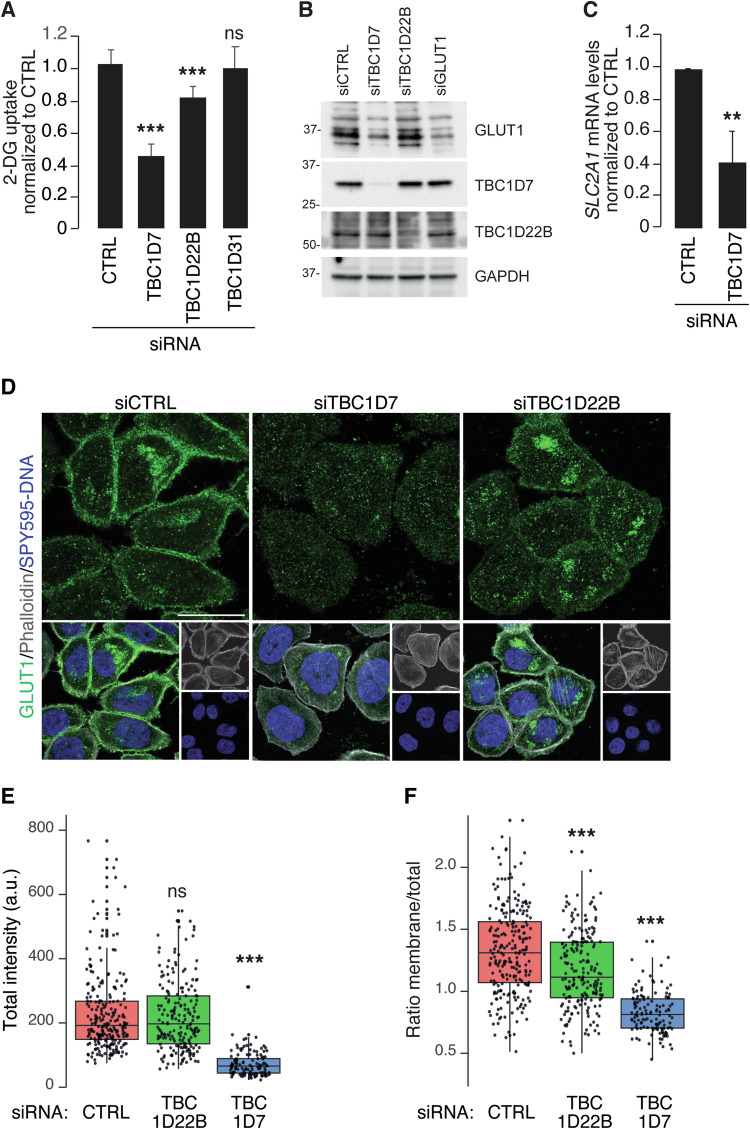
Fig. 5. Effects of TBC1Ds depletion on glycolysis.
A Bar graph of 2-deoxyglucose (2-DG) uptake measured in MDA-MB-468 cells silenced with control siRNA (siCTRL), TBC1D7 siRNA (siTBC1D7), TBC1D22B siRNA (siTBC1D22B), TBC1D31 siRNA (siTBC1D31). Values are the mean ± SD of 3 independent experiments, n = 18. B IB analysis of GLUT1 expression levels in deglycosylated lysates from MDA-MB-468 cells silenced as indicated on top; GAPDH, loading control. MW markers are shown in KDa. Because GLUT1 is highly glycosylated, we performed deglycosylation of the lysates to better compare the total amount of GLUT1 in the various samples. C Real-time PCR measuring the SLC2A1 (encoding GLUT1) mRNA levels in MDA-MB-468 cells silenced as indicated on bottom. The bar graph is the mean ± SD of 3 independent experiments, n = 9. D Representative confocal images of cells, silenced as indicated on the top, and stained with anti-GLUT1 antibody (in green in the top row and in the merged images in the bottom row), and 647-Phalloidin for actin detection (in gray, bottom row) and SPY595-DNA to reveal the nuclei (in blue, bottom row). Images are projection of 4 Z-stacks. Bar 20 μm. E, F Quantitative analysis of GLUT1 localization in the silenced cells. The indicated number of cells, was analyzed as described in Materials and Methods. The box plot in E shows the total intensity/cell, expressed in arbitrary units (a.u.). The box plot in F shows the ratio of mean GLUT1 intensity at the plasma membrane/total. In A, C, E, F: **P < 0.01; ***P < 0.001; ns not-significant.

