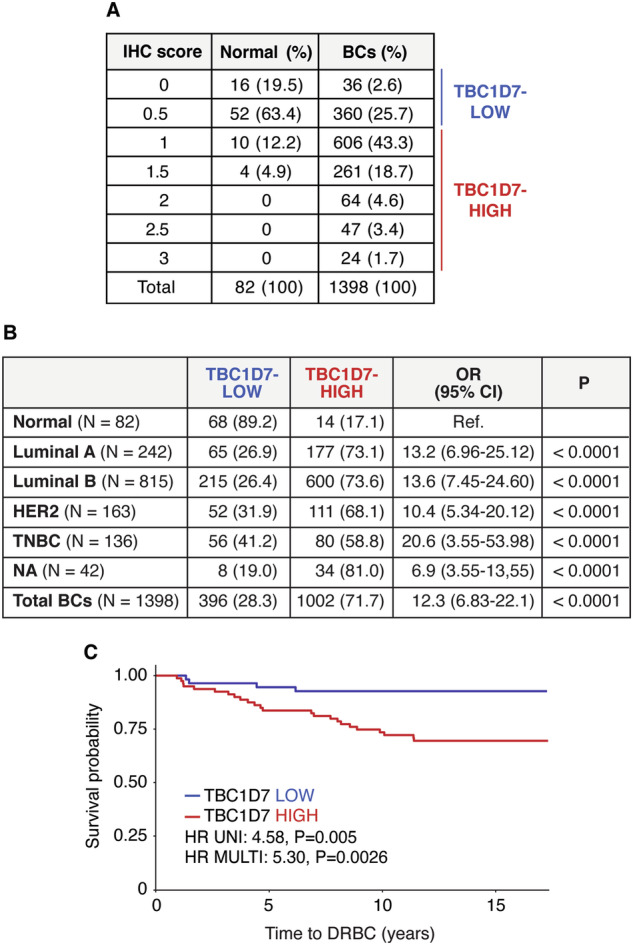
Fig. 6. TBC1D7 is overexpressed at the protein level in BCs compared to normal breast tissues and predicts prognosis in TNBCs.

A FFPE samples of normal breast tissue (n = 82) and BC cases from the IEO consecutive cohort (n = 1398) were evaluated for TBC1D7 expression levels. The number of cases displaying each IHC score is shown (percentage in parentheses). Samples were divided into two subgroups: TBC1D7-LOW (IHC score < 1) and TBC1D7-HIGH (IHC score ≥ 1). B The number and percentage of TBC1D7-LOW and TBC1D7-HIGH normal and BC samples are reported in the table. The two-class model was used to calculate the odds ratio (OR) with 95% confidence intervals (CI). The p-value was calculated using Pearson’s Chi-Squared Test. C Kaplan–Meier analysis of time to DRBC in the TNBC subgroup of the IEO cohort, stratified using the two-class model of TBC1D7 protein expression. Univariate (UNI) and multivariable (MULTI) hazard ratios (HRs) were calculated using the Cox proportional hazards regression model in the ‘survival’ package of R, version 3.5–5. The multivariable analysis was adjusted for age, tumor size, tumor grade, nodal status, and Ki-67.
