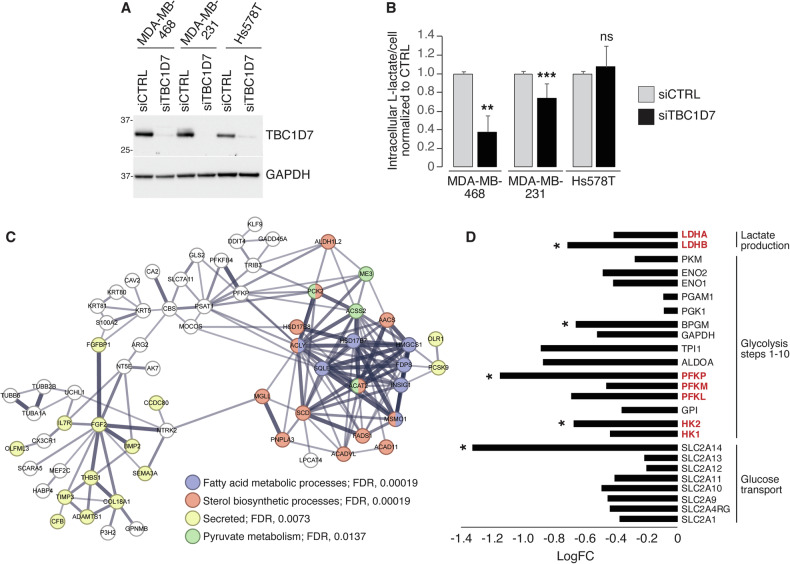
Fig. 7. Expression of TBC1D7 is needed to maintain a glycolytic phenotype in TBC1D7-HIGH TNBC lines.
A IB analysis of TBC1D7 expression levels in the indicated TNBC cell lines, in the presence of control siRNA (siCTRL) or TBC1D7 siRNA (siTBC1D7). GAPDH, loading control. MW markers are shown in KDa. B Intracellular L-lactate levels were measured in the indicated TNBC cell lines, silenced for TBC1D7 (siTBC1D7) or transfected with control siRNA CTRL. Data are expressed as mean ± SD of l-lactate per cell, normalized to the respective siCTRL in each cell line (n = 6 technical replicates from 3 independent experiments except for MDA-MB-231 cells where n = 8 technical replicates from 4 independent experiments). C STRING network analysis of genes classified as downregulated following TBC1D7 silencing in MDA-MB-468 cells, using a cut-off of FC ± 2.0, FDR < 0.05. The search was performed at a high-confidence setting (0.7). In the network, the thickness of the edges indicates the strength of supporting data. Non-connected nodes were not included. The “analysis” tool of STRING was used to select GO, KEGG, and Wiki terms/pathways. Selected terms are highlighted indicated by a color code. D Expression analysis of glycolytic genes in TBC1D7-silenced MDA-MB-468 cells. Values are plotted as the FC in TBC1D7-KD vs. CTRL siRNA cells (details are in Supplementary Table 10). In red, genes encoding rate-limiting enzymes. Note that in the entire RNAseq dataset, 17,329 genes were present of which 8054 were positively regulated and 9 275 negatively regulated following TBC1D7 KD (regardless of significance). Thus, for a single random gene the probability of being downregulated in the dataset was 0.535, and the probability of 24 random genes being simultaneously downregulated was 0.53524, i.e., 3.02 × 10⁻⁷. In B: **p < 0.01; ***p < 0.001; ns, not-significant. In D, *, significantly regulated at FC < 1.5, FDR < 0.05.

