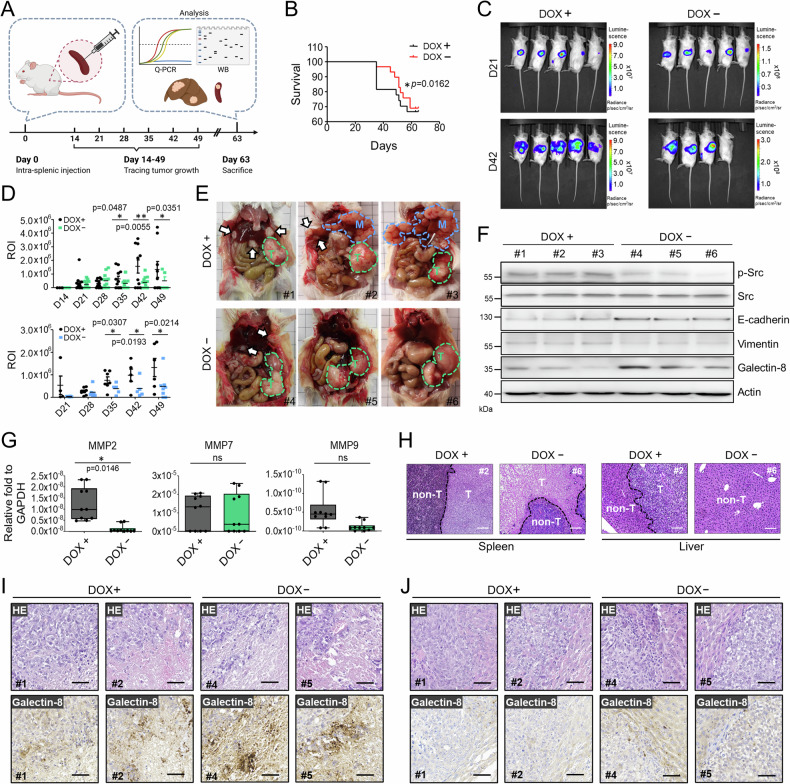
Fig. 3. Induction of galectin-8 suppresses liver metastases from intra-splenically implanted CRC cells.
A Scheme of intra-splenic implantation of galectin-8 Tet-off DLD1-Luc cells and subsequent examination of metastasis. Implanted NOD-SCID mice were treated with or without doxycycline (DOX, 200 µM in drinking water), monitored for tumor burden, or sacrificed for various analyses at indicated days. B Kaplan–Meier survival curves of NOD-SCID mice implanted intra-splenically with galectin-8 Tet-off DLD1-Luc cells with or without DOX treatment (200 µM). n = 10 per group. Statistical significance was determined using the log-rank test. C Representative bioluminescence images of NOD-SCID mice treated with or without DOX at 21 days and 42 days after intra-splenic implantation of galectin-8 Tet-off DLD1-Luc cells. D The bioluminescence intensity of the regions of interest (ROI) detected from primary tumors (upper panel) and metastatic nodules (lower panel) at indicated days after implantation. E Gross images of galectin-8 Tet-off DLD1-Luc tumor-bearing mice treated with or without DOX show the primary tumors (green dotted circles, marked as T) and metastatic nodules (arrows and blue dotted circles, marked as M) at day 63 after implantation. F Western blot analysis of the expression of phosphorylated and total Src, E-cadherin, Vimentin, and galectin-8 in the primary tumor mass of spleen from galectin-8 Tet-off DLD1-Luc tumor-bearing mice with or without DOX treatment. Actin was used as the loading control. G RT-qPCR analysis of mRNA levels of MMP-2, MMP-7, and MMP9 in tumor tissues from the spleen in (E). H Hematoxylin-eosin (HE) staining showing the boundary between tumorous (T) and non-tumorous (non-T) tissues in the liver and spleen of galectin-8 Tet-off DLD1-Luc tumor-bearing mice. Scale bar = 100 μm. (I and J) HE staining and IHC staining of galectin-8 expression with sections derived from the primary lesions in spleen (I) and metastatic lesions in liver (J) in (E). Scale bar = 50 μm. Results in D and G are shown as mean ± SD (3 independent experiments in the upper panel of D; 3 independent experiments in the lower panel of D; 5 biological replicates with technical duplicate for G). Statistical tests in D and G were calculated by t-test. ns not significant.

