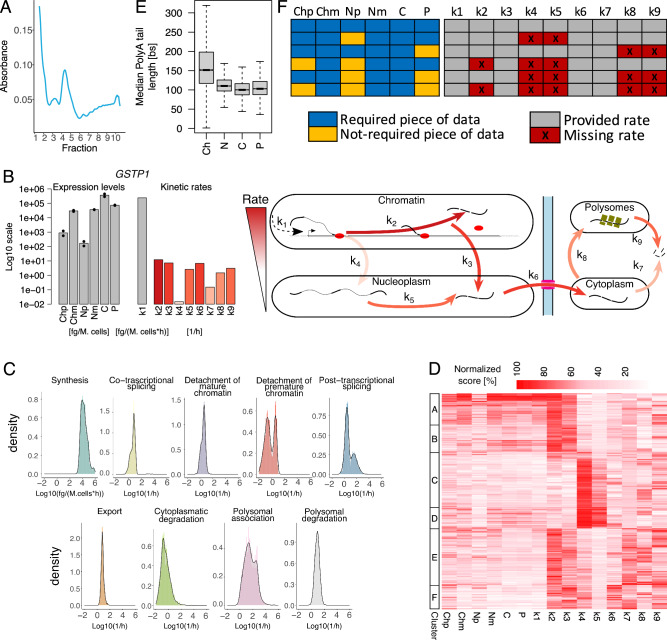
Fig. 2. Nanodynamo unravels complex RNA dynamics of SUM159 triple-negative breast cancer cells.
A Typical polysome trace for untreated SUM159 cells. B Schematic representation of the Nanodynamo framework, from input data to kinetic rates interpretation, for the gene GSTP1. Left, RNA species expression levels (bars and dots report mean and single replicate values respectively). Centre, kinetic rates coloured according to their relative values; the synthesis rate was reported in grey because of its different unit of measurement. Right, cartoon depicting the different efficiencies of the RNA life cycle steps. C Kinetic rates distributions in log10 scale. D Heatmap reporting for each modelled gene (rows) RNA species abundance and kinetic rates magnitude (columns). For each column, values are saturated between the 1st and 99th percentiles and normalised against the latter. The left bar indicates groups of genes identified by k-means clustering according to normalised abundances and kinetic rates. E Gene-level median polyA tail length distributions across RNA pools. F RNA species and kinetic rates for the simplified models (rows) implemented in Nanodynamo, compared to the complete model (1st row); input data required for each model are indicated in blue (not required in yellow) while the provided kinetic rates are indicated in grey (missing rates in red). In the figure, Ch, N, C, and P denote chromatin associated, nucleoplasmic, cytoplasmic, and polysomal RNA, respectively, while p and m additionally specify premature or mature forms. Analyses in C, D were performed on 1914 genes processed with the complete model while the analysis in E was performed on all the genes with at least one read with profiled polyA tail after replicates pooling (11774, 11957, 11760, 12739 genes for the chromatin, nucleoplasmic, cytoplasmic, and polysomal fractions respectively). For boxplots, the horizontal line represents the median value, the box edges represent the 25th (Q1) and 75th (Q3) percentiles, and the whiskers show the range of data excluding outliers (observations lower that Q1 − 1.5 * interquartile range or larger than Q3 + 1.5 * interquartile range). Source data are provided as a Source Data file.

