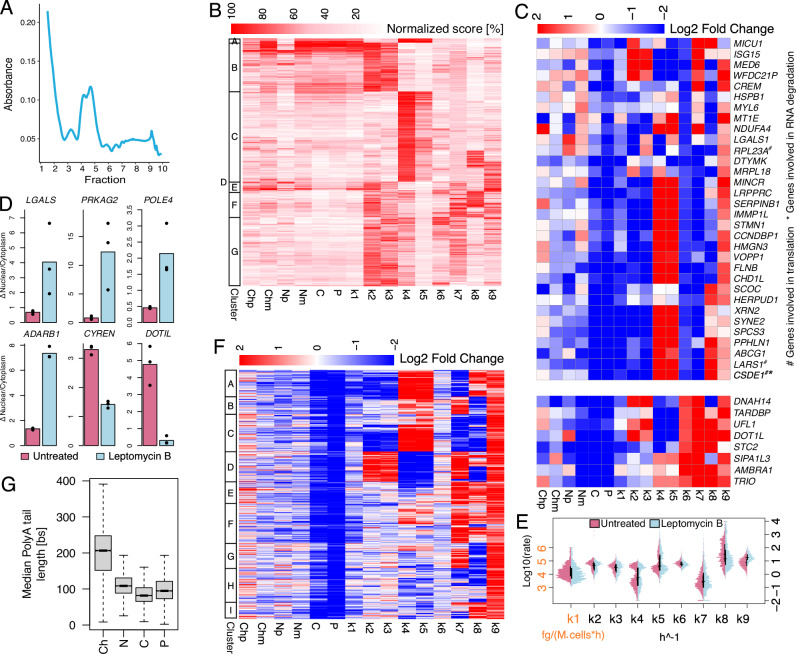
Fig. 4. Perturbation of the export machinery with Leptomycin B leads to downstream alterations of translation and degradation machineries.
A Typical polysome trace for treated cells. B Heatmap reporting for each modelled gene (rows) RNA species abundance and kinetic rates magnitude (columns). For each column, values are saturated between the 1st and 99th percentiles and normalised against the latter. The left bar indicates gene sets similar in abundances and kinetic rates (k-means clustering). C Heatmap depicting genes (rows) abundances and kinetic rates modulations (columns - log2 fold changes saturated between −2 and +2) in response to Leptomycin B treatment for genes reduced or induced in export (k6 log2 fold change < −1.5 or > 1.5 respectively). D Nuclear vs cytoplasmic RNA expression, relative to RPLPO, for the indicated genes in untreated cells (purple) and after 16 h of Leptomycin B treatment (light blue); 3 technical replicates and their mean values are reported. E Kinetic rates distributions in log10 scale for untreated (purple) and treated (light blue) cells; horizontal and vertical black lines represent medians and interquartile ranges of the distributions, respectively. F As in C for 1371 genes modelled both in untreated and treated cells. The left bar indicates gene sets similar in abundances and kinetic rates modulations (k-means clustering). G Gene-level median polyA tail length distributions across RNA pools. In the figure, Ch, N, C, and P denote chromatin associated, nucleoplasmic, cytoplasmic, and polysomal RNA while p and m specify premature and mature forms. Analyses reported in B, E were performed on 1371 genes processed with the complete model in the treated condition. The analysis reported in F was performed on 778 genes processed with the complete model in both untreated and treated conditions. The analysis reported in G was performed on genes with at least one profiled polyA tail after replicates pooling (12620, 11369, 10138, 12028 genes for Ch, N, C, and P). For boxplots, the horizontal line represents the median value, the box edges represent the 25th (Q1) and 75th (Q3) percentiles, and the whiskers show the range of data excluding outliers (observations lower that Q1 − 1.5 * interquartile range or larger than Q3 + 1.5 * interquartile range). Source data are provided as a Source Data file.

