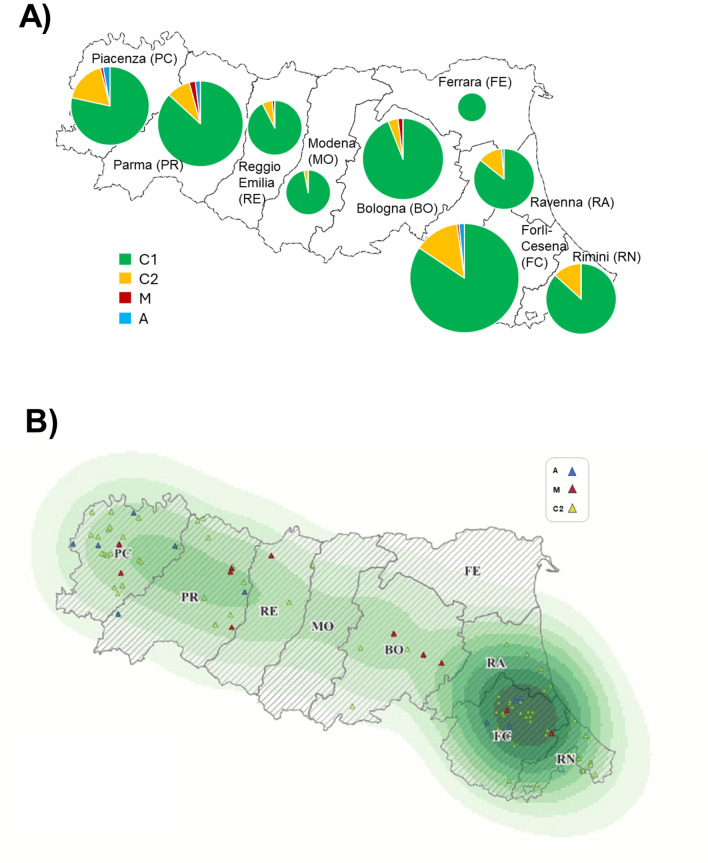
Fig. 3.
Distribution of the mtDNA haplotypes in the Emilia-Romagna region across the three years of sampling. (A) Frequency of the C1, C2, M and A haplotypes in the different administrative provinces. The chart size is proportional to the number of honey bees analysed for each administrative province. (B) Density map of the analysed honey bees carrying the C1 mtDNA haplotype. The same map reports information of the geographical position of the apiaries from which some honey bees carried the A (blue triangle), C2 (yellow triangle), or M (red triangle) mtDNA haplotypes.

