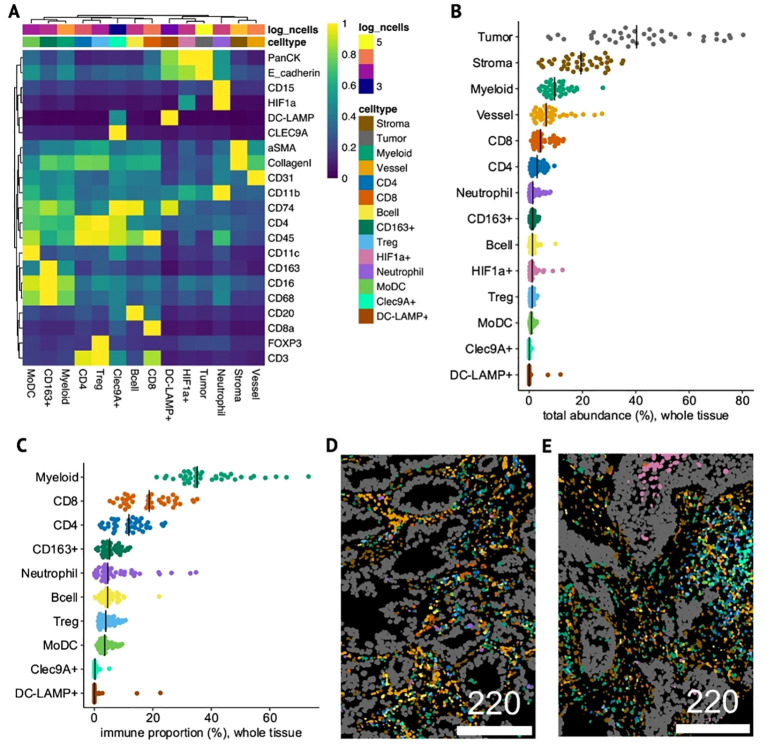
Figure 5.
Identity and composition of cell-types in NSCLC tumor samples. (A) Heatmap of mean phenotypic marker expression (min-max-scaled) in each of the 14 annotated cell-types detected by IMC. (B, C) Dotplots showing total abundance of each cell-type relative to all cells (whole-tissue) (B) and proportion of each immune cell-type relative to only immune cells in whole-tissue (C). (D, E) Single-cell segmented IMC images colored by cell-type in a non-squamous, ICI OS-low patient with high tAXL expression (Hscore=170) (D) and in a squamous, ICI OS-high, AXL Hscore-negative patient (E). Scale bars in μm.

