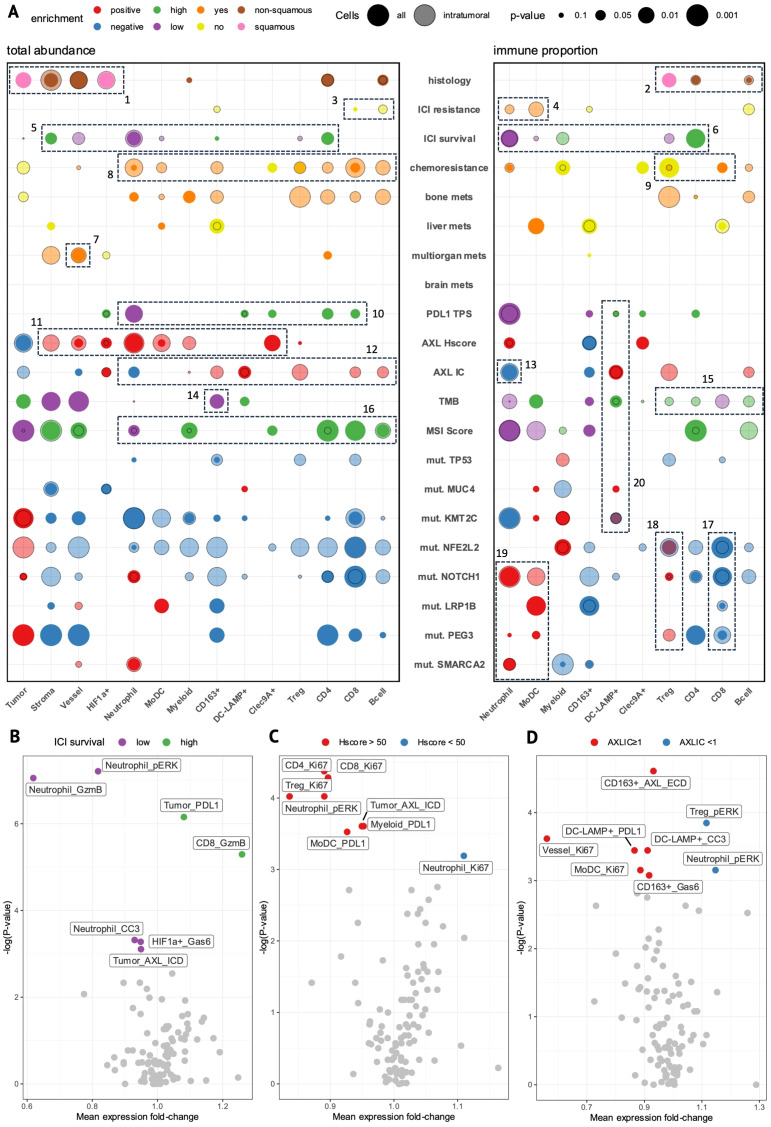
Figure 6.
The cell-type composition and functional state of specific cell types associates with clinical and molecular features. (A) Bubble-plot showing enrichment of cell-type abundance (left) and immune proportion (right) of cell-types in tumor cores stratified by clinical or molecular features. Circle size represents the degree of significance and color represents the group in which the enrichment occurs. Solid circles represent enrichment in the whole tissue area (all cells) while transparent circles represent enrichment within the tumor boundary (intratumoral cells). (B–D) Volcano plots of significance (p-value) versus mean protein expression (fold-change) show differentially-expressed state markers within each cell-type (cutoff: p<0.05, Mann-Whitney) between tumor cores stratified by ICI survival-low (purple) versus -high (green) (B), AXL Hscore-high (Hscore >50, red) versus -low (Hscore <50, blue) (C), and AXL IC-positive (AXLIC ≥1, red) versus -negative (AXLIC <1, blue) (D). (B,D) generated from intratumoral cells; (C) generated from all cells.

