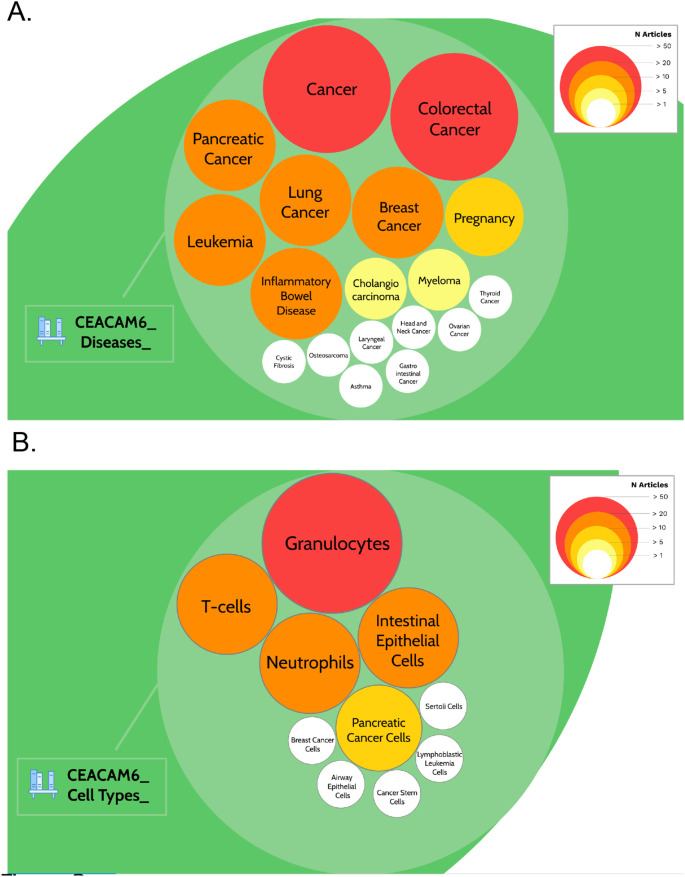
Figure 2. CEACAM6 disease and cell type literature profiles.
The prevalence of articles among the literature associated with CEACAM6 for disease entities (A) or cell type entities (B) are represented by circles of different sizes and colors, corresponding to the number of associated articles. It is possible to access underlying information by zooming into each of the circles. The Prezi presentation can be accessed at this url: https://prezi.com/view/pQ7TKEC6tgY3cuik9ckt/ Step 3: background literature profiling.

