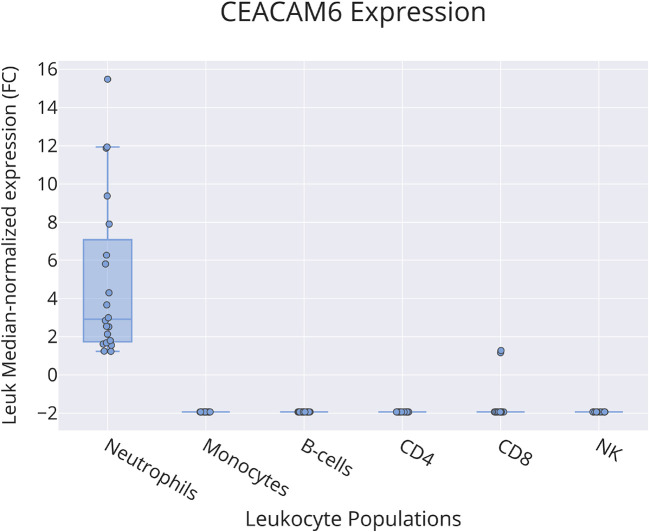
Figure 4. CEACAM6 restriction among circulating leukocyte populations.
This box plot shows levels of abundance of CEACAM6 RNA measured by RNA sequencing in neutrophils, monocytes, B-cells, CD4+ T-cells, CD8+ T-cells and NK cells purified from the blood of human subjects, including patients with ALS, type 1 diabetes, multiple sclerosis (immediately before and 24 hours after initiation of beta interferon therapy) or sepsis and healthy controls. Values are normalized to the median calculated across all conditions. For details, see original work by Linsley et al. 60
GEO deposition: https://www.ncbi.nlm.nih.gov/geo/query/acc.cgi?acc=GSE60424 plot: https://plotly.com/~dchaussabel/171/.

