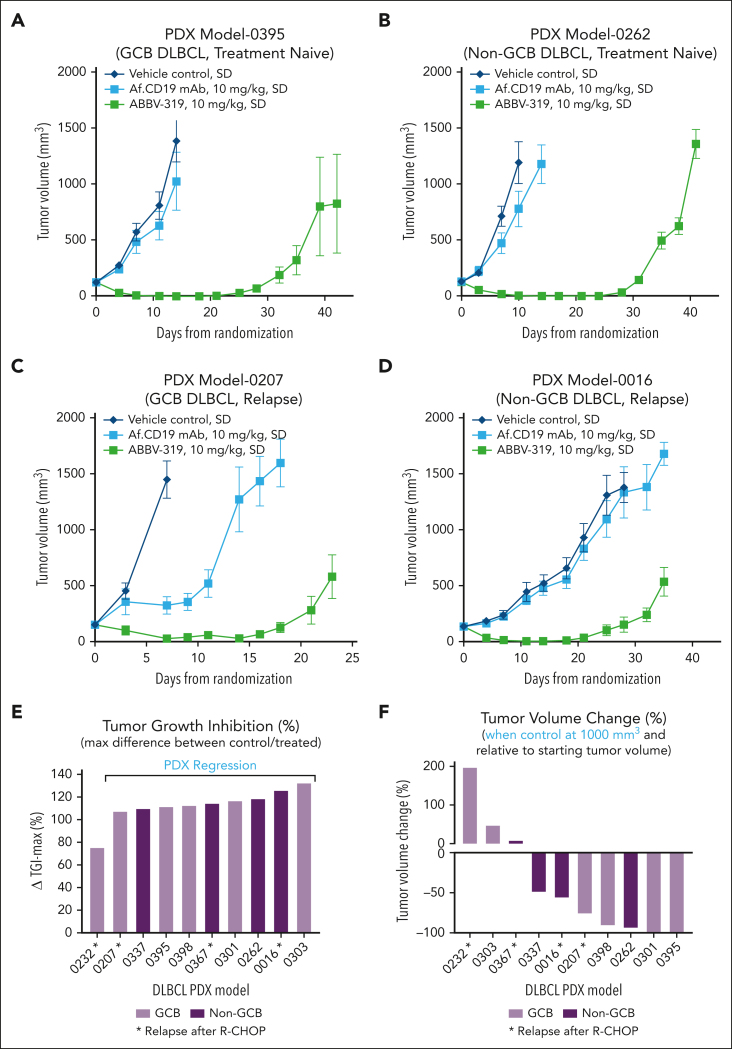
Figure 5.
ABBV-319 exhibits antitumor activity in non-GCB DLBCL and relapsed DLBCL PDX models. (A-D) Growth of xenografted PDX models 0395 (A), 0262 (B), 0207 (C), and 0016 (D) in NOD-SCID mice after the indicated treatment regimen. Means ± SEM of tumor volumes were plotted for each treatment group vs days from randomization. (A) and 0262 (B) were treatment naïve whereas PDX models 0207 (C) and 0016 (D) were from relapsed disease after the 4 R-CHOP treatments. GCB and non-GCB subtyping were determined via immunohistochemistry methods, as described in “Methods.” (E) Maximal percentage tumor growth inhibition relative to the vehicle control in each PDX model is displayed. Models showing tumor regression after ABBV-319 treatment are shown in the figure. (F) Percentage tumor volume change relative to the starting tumor volume when the vehicle control reaches 1000 mm3. GCB and non-GCB DLBCL are shown as different colors. ∗Denotes PDX samples from patients with relapsed disease after R-CHOP treatment.

