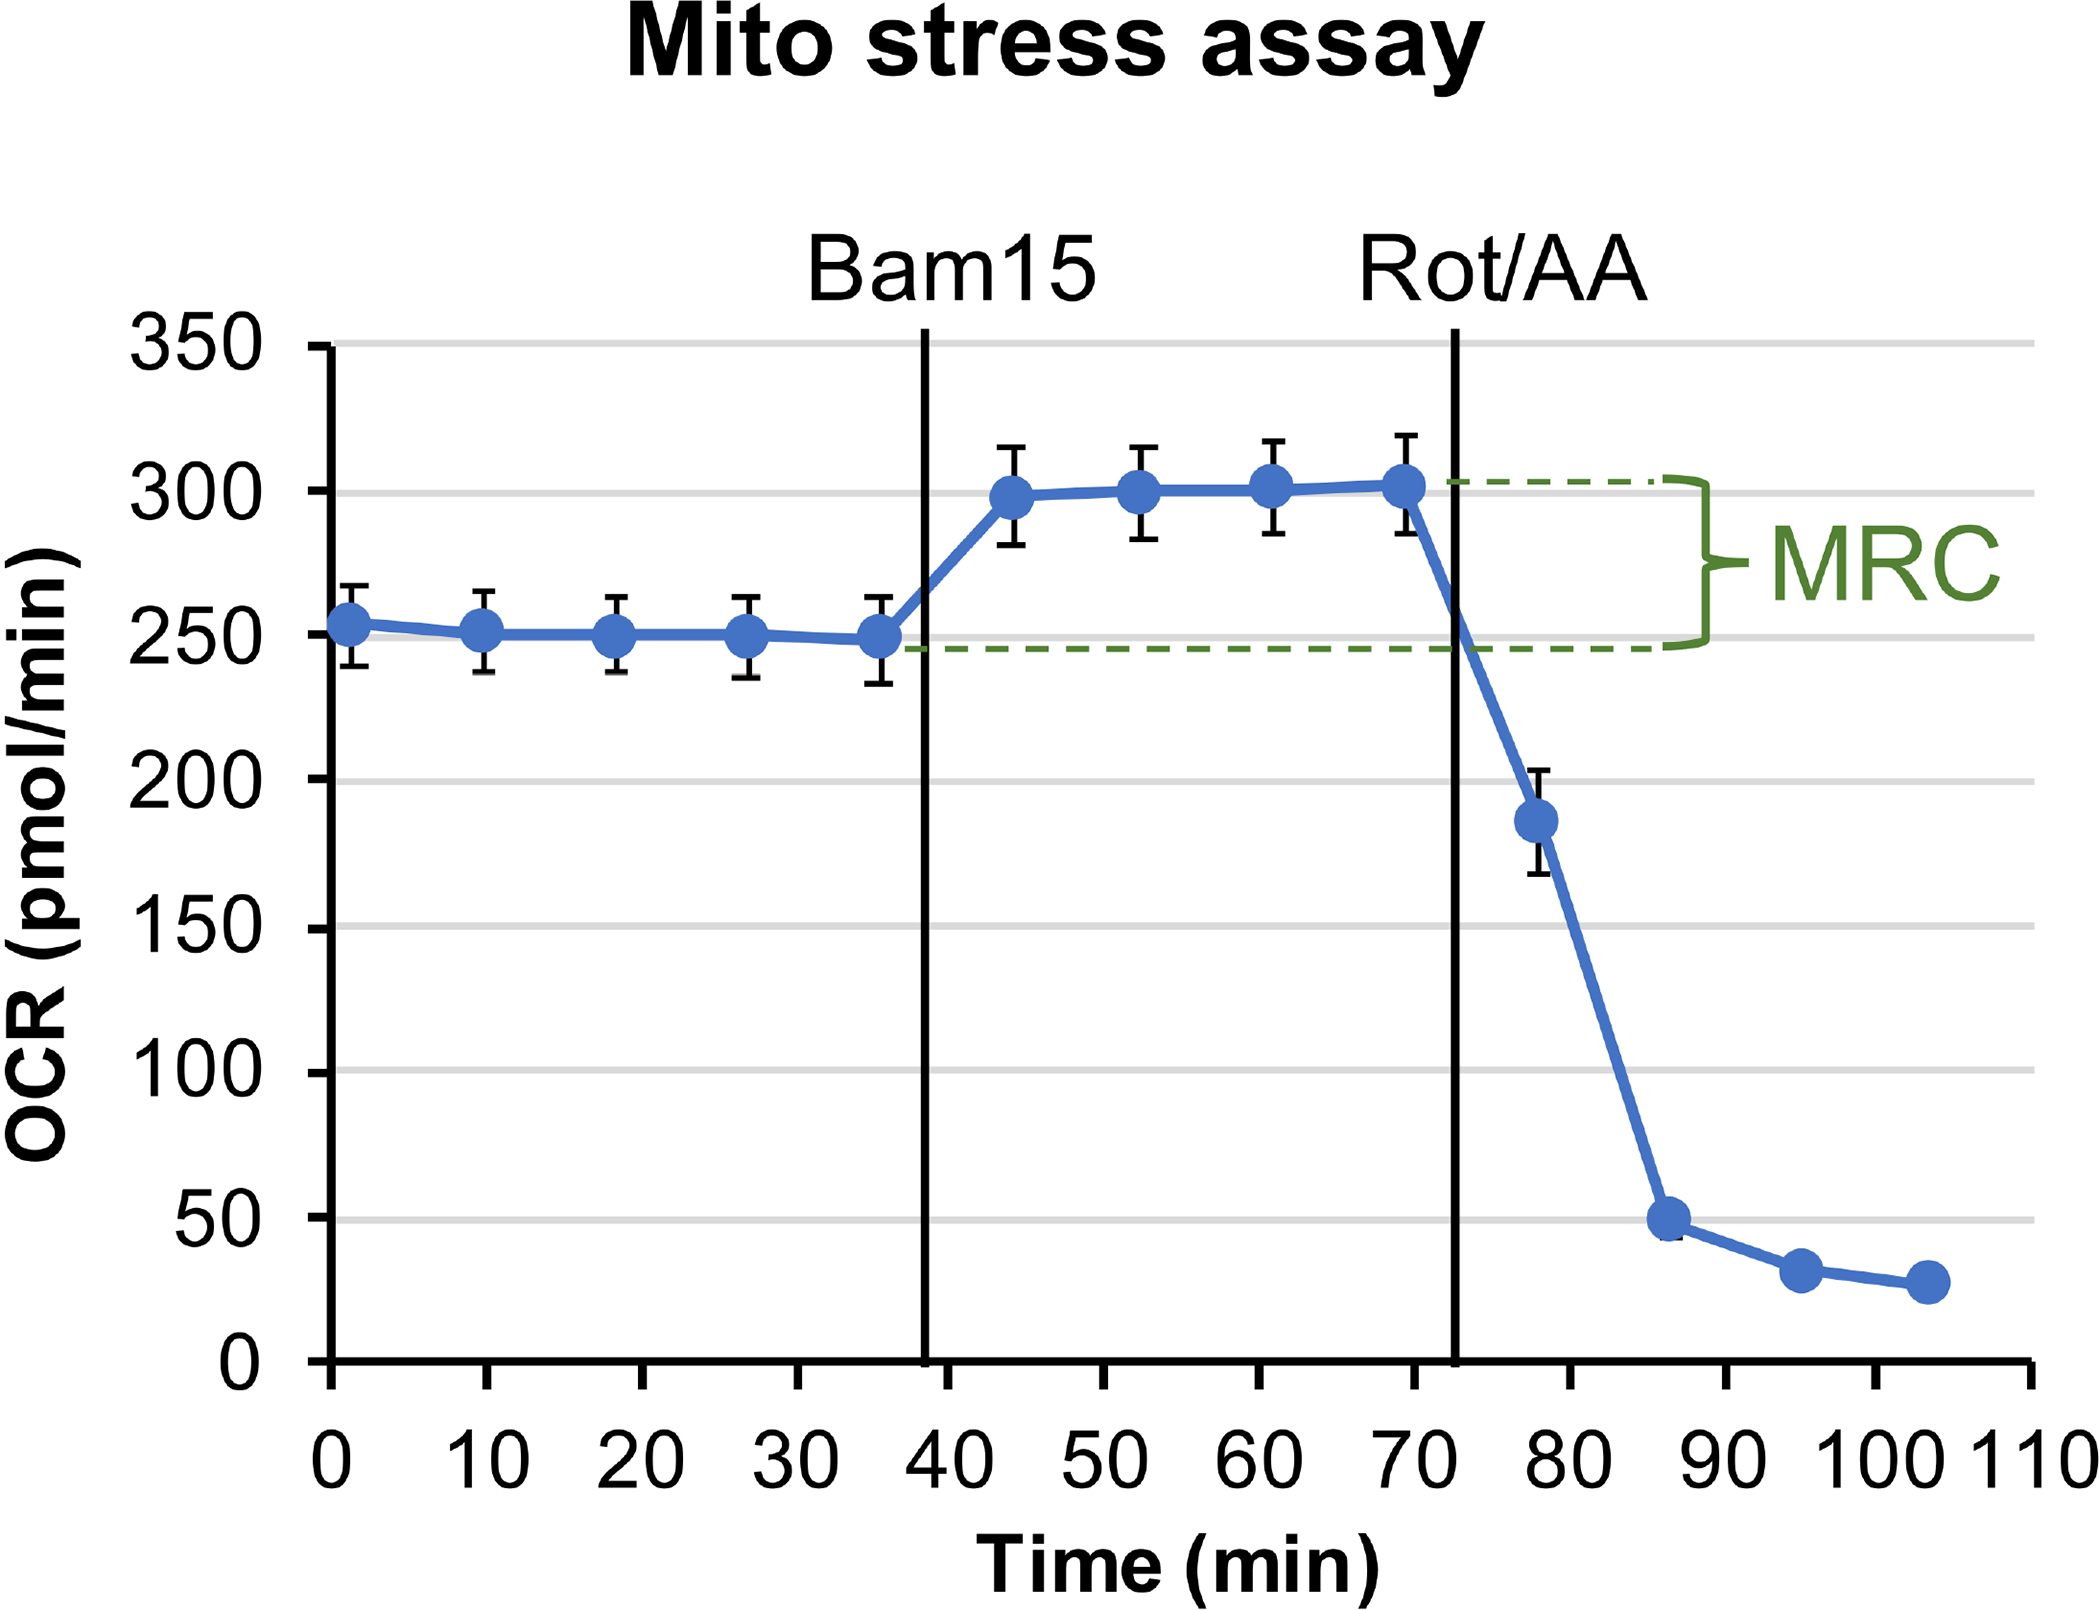
Figure 1: Mitochondrial stress assay.

The plotted graph shows OCR trace from 1 mm retinal punch disks in Seahorse XF DMEM buffer, supplemented with 6 mM of glucose, 0.12 mM of pyruvate and 0.5 mM of glutamine. Each data point represents the average of measurements from 10 wells. Error bar = standard error. MRC is calculated to be 19.2%±3.4%.
