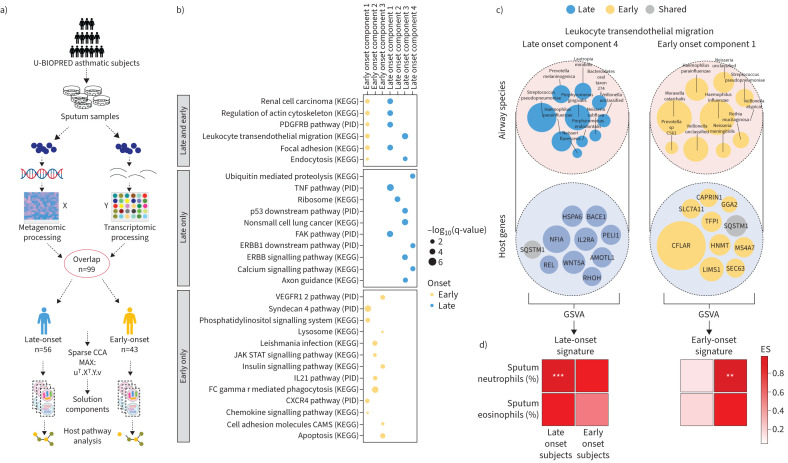
FIGURE 1.
a) Flowchart showing the overall method of sample collection, cohort grouping and the application of sparse canonical correlation analysis (Sparse-CCA). b) Component genes pathway analysis showing the enrichment of pathways for each component. c) Visualisation of leukocyte transendothelial migration for both adult and child onset showing the top 10 genes and species by absolute weights. d) Gene set variation analysis (GSVA) sample-wise enrichment score (ES) correlation with clinical characteristics showing the correlation of the ES of each gene set from the components in the leukocyte transendothelial migration pathway with sputum neutrophils and eosinophils. KEGG: Kyoto Encyclopaedia of Genes and Genomes; PID: pathway interaction database; TNF: tumour necrosis factor. Significance of Spearman coefficient correlation: not significant (p>0.05) indicated by clear box; **: p≤0.01; ***: p≤0.001.

