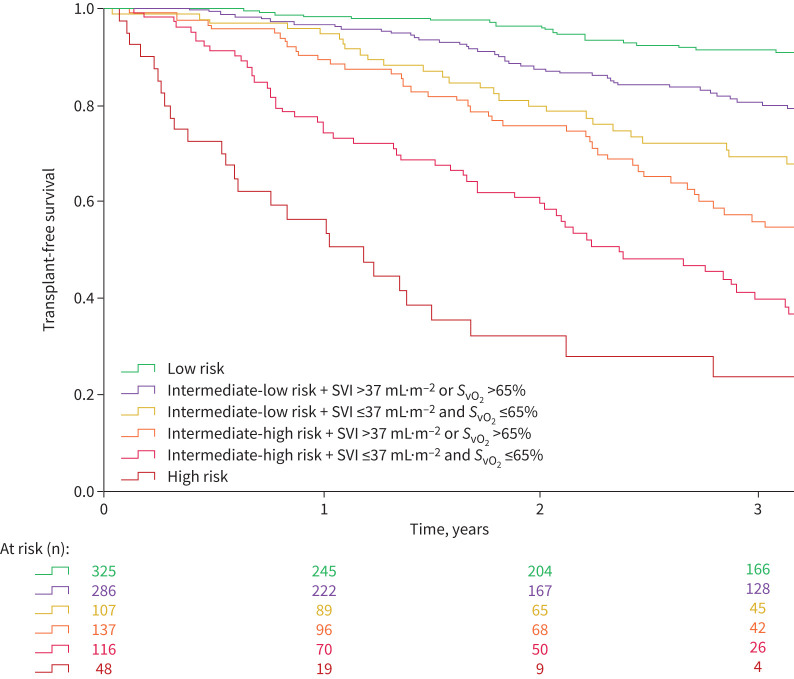
FIGURE 4.
Kaplan–Meier survival curves according to risk status calculated from the three non-invasive variables (World Health Organization/New York Heart Association Functional Class, 6-min walk distance and brain natriuretic peptide (BNP)/N-terminal pro-BNP) and stroke volume index (SVI) and/or mixed venous oxygen saturation (SvO2).

