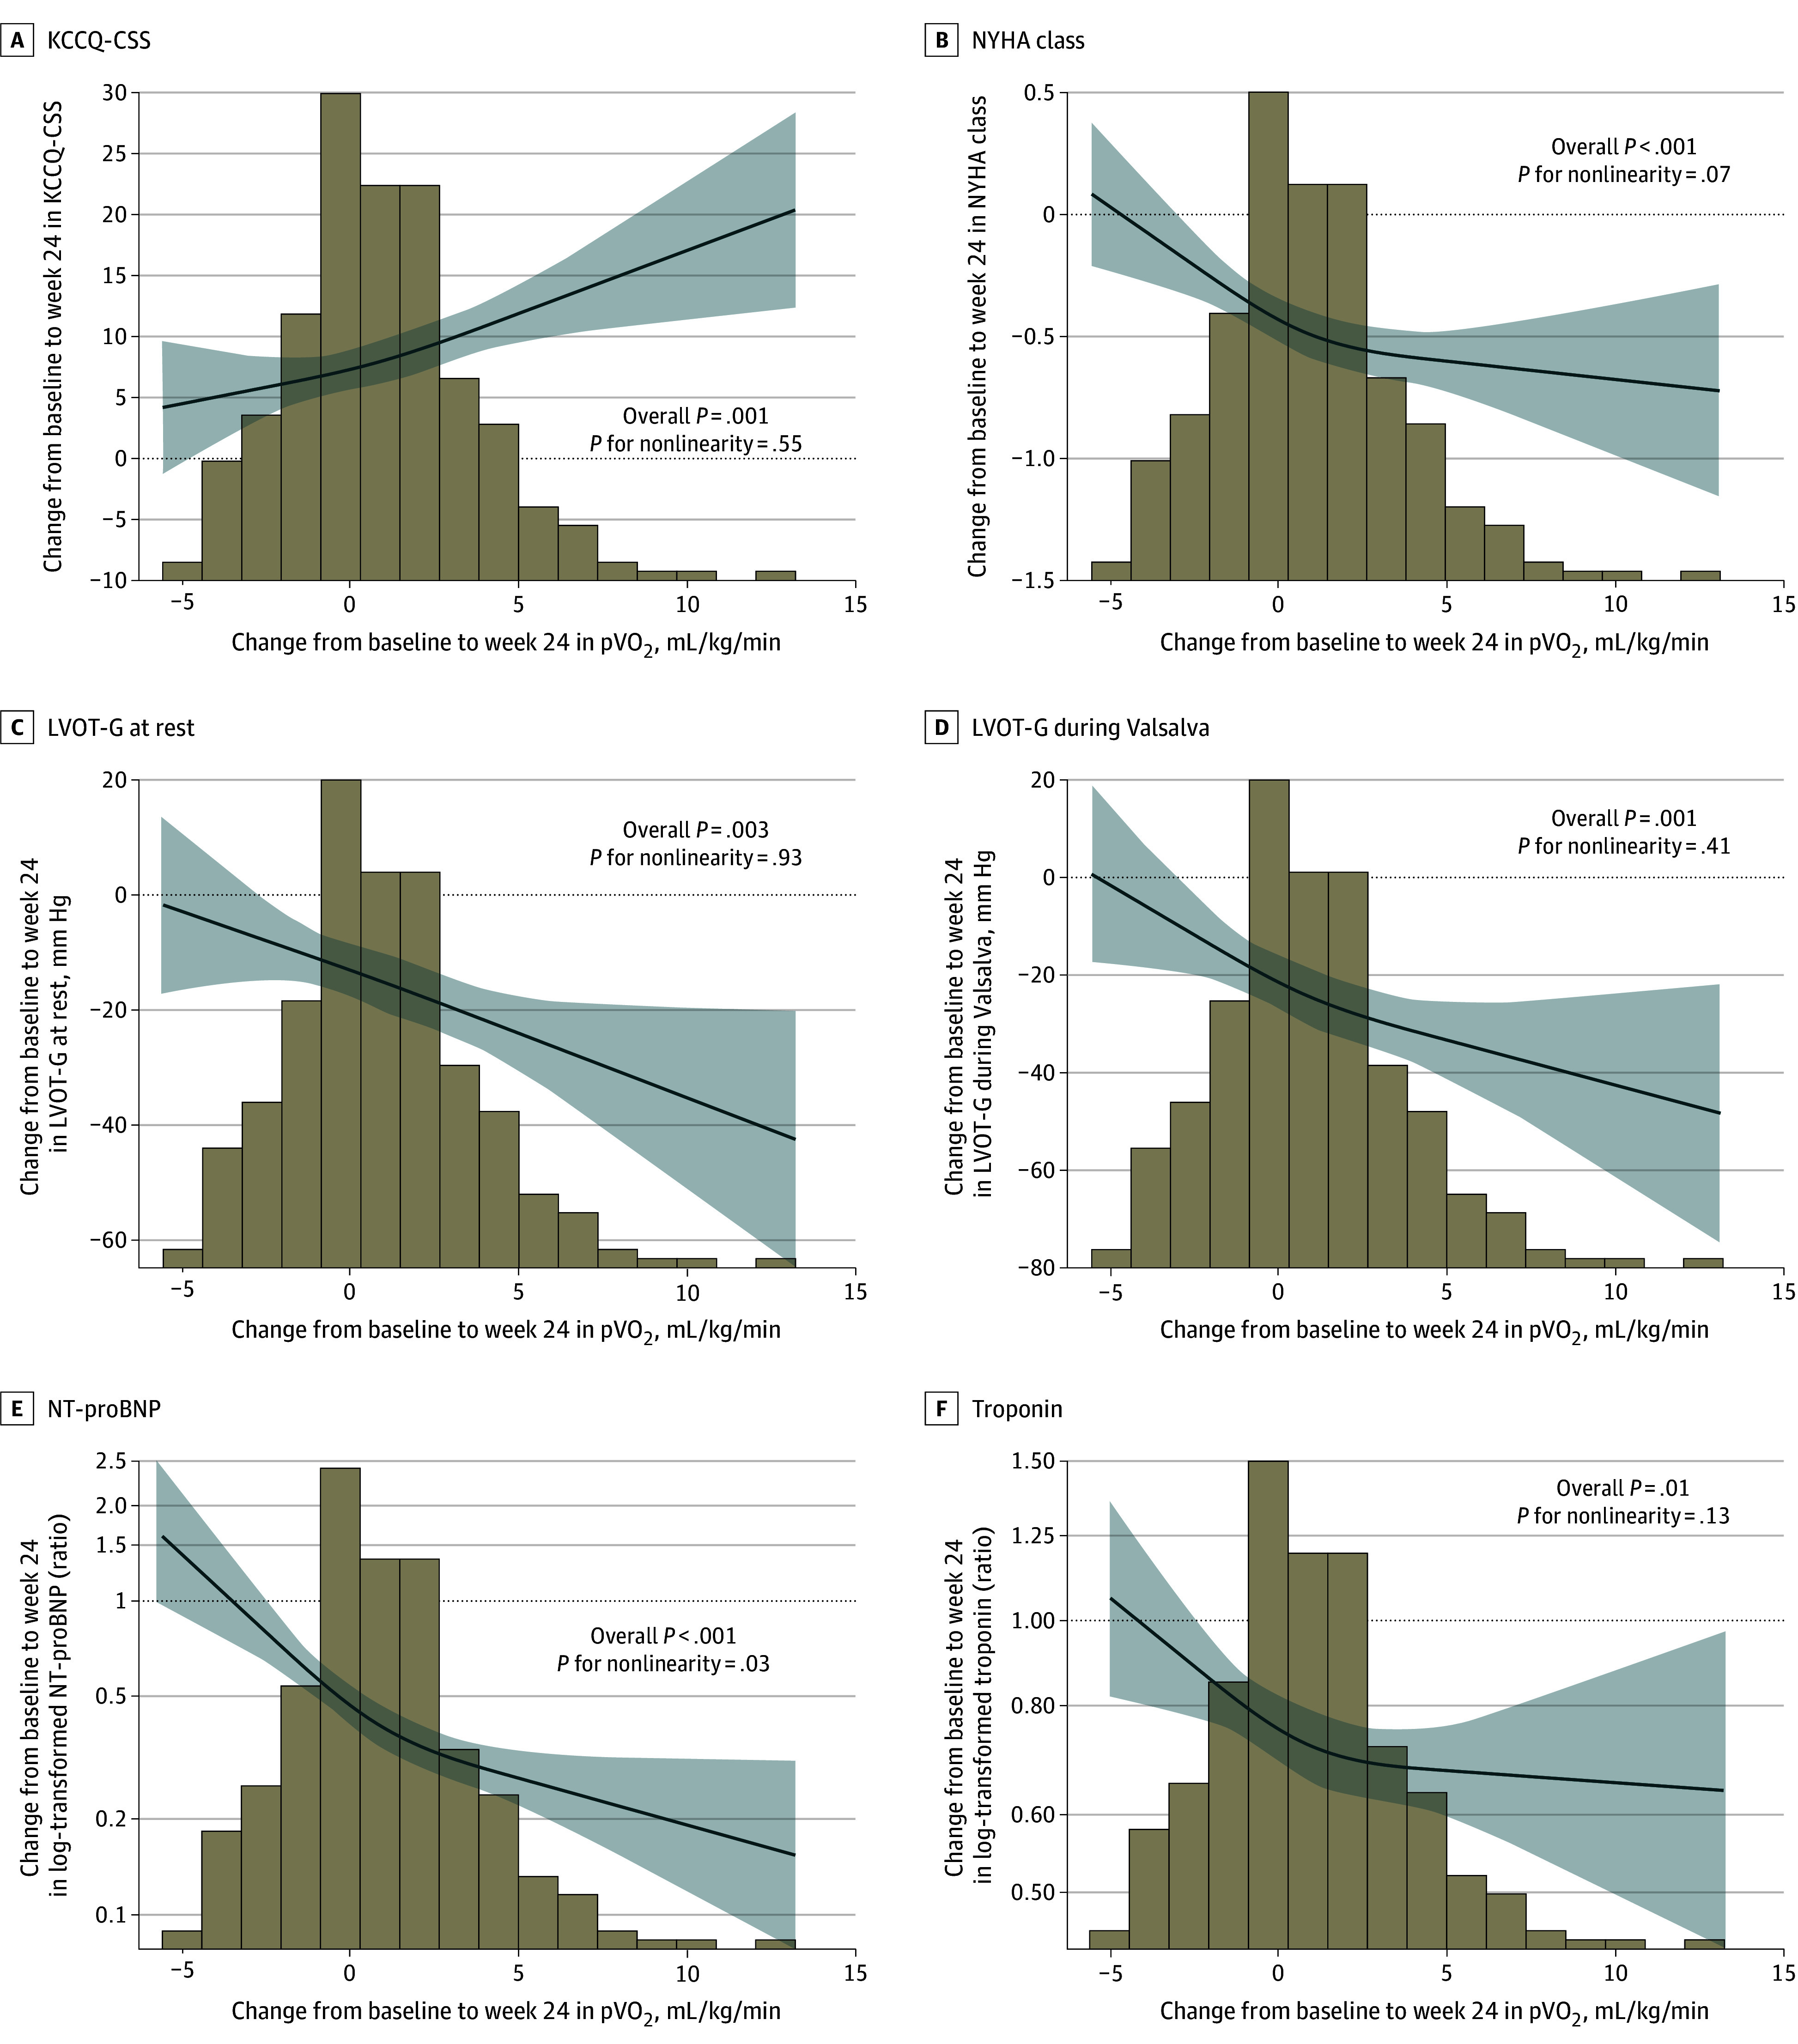
Figure 3. Cubic Spline Graphs: Correlation Between Change in Peak Oxygen Uptake (pVO2) and Clinical Metrics.

The panels display the change in pVO2 from baseline to 24 weeks for the following: Kansas City Cardiomyopathy Questionnaire-Clinical Summary Score (KCCQ-CSS) (A), New York Heart Association (NYHA) functional class (B), resting left ventricular outflow tract gradient (LVOT-G) (C), Valsalva LVOT-G (D), N-terminal pro–brain natriuretic peptide (NT-proBNP) (E), and high-sensitivity cardiac troponin I (hs-cTnI) (F). Graphs display linear regression with cubic terms. Analyses adjusted for baseline values of both parameters. Solid lines show the association correlate, and shaded areas show the 95% CIs. Histograms show the distribution of change in pVO2.
