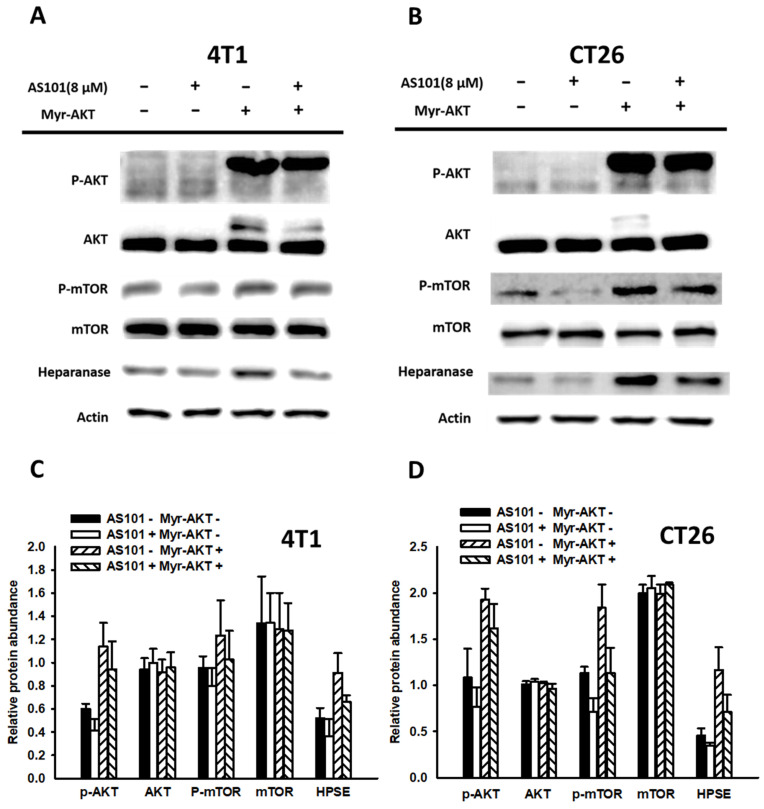
Figure 5.
Correlation between heparanase and the AKT/mTOR signaling pathway. 4T1 (A) and CT26 (B) cells (5 ×10⁴ cells per well) were transfected with a myr-AKT plasmid, including constitutive AKT expression for 16 hours. Subsequently, the cells were treated with AS101 for an additional 24 hours. The protein levels of heparanase, AKT and mTOR were measured using Western blotting. Quantification histograms of 4T1 (C) and (D) CT26 are presented beneath each Western blotting plot. Data are expressed as the mean ± SD of three repeated determinations.

