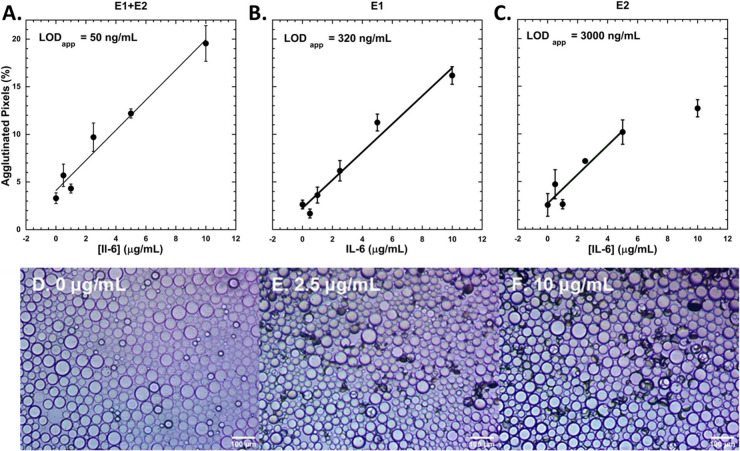
Figure 4.
Dose response curves for A. 1:1 ratio of E1+PEG- and E2+PEG- functionalized Janus droplets (k = 1.591, R = 0.98), B. E1+PEG-functionalized droplets (k = 1.445, R = 0.99), and C. E2+PEG-functionalized droplets (k = 1.559, R = 0.95) after overnight incubation with IL-6. Data are fit to linear responses, and standard errors are reported. The last data point for C. is excluded from the linear fit. Data represent n ≥ 3 replicates. Representative images of agglutinated droplets (1:1 ratio of E1+PEG- and E2+PEG- functionalized) after incubation with D. 0 μg/mL, E. 2.5 μg/mL, and F. 10 μg/mL of IL-6.

