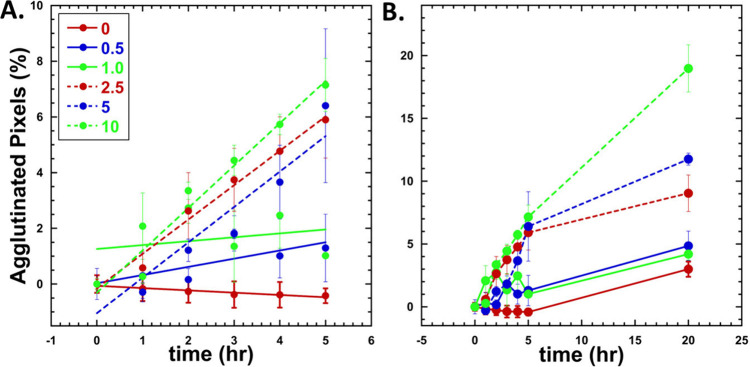
Figure 5.
Kinetics of agglutination at various concentrations (0–10 ug/mL) A. First 5 h after addition of IL-6. Lines indicate linear fit of data (0 μg/mL = −0.082, R = 0.95, 0.5 μg/mL = 0.29, R = 0.76, 2.5 μg/mL = 1.23, R = 0.99, 5 μg/mL = 1.27, R = 0.94, and 10 μg/mL = 1.52, R = 0.98. 1.0 μg/mL did not fit well to a linear (R = 0.255) but fit is still shown. B. Line graph of data collected overnight indicated increase in agglutination over time as a function of concentration. Standard error is displayed. Data represent n ≥ 3 replicates.

