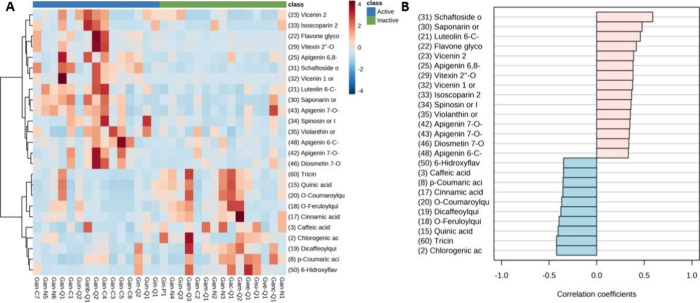
Figure 11.
(A) Hierarchical clustering analysis (HCA) with heatmap illustrating the difference in the compounds annotated abundance between active and inactive samples. The x-axis shows the clustering of all the samples, and the y-axis shows the clustering of the 25 compounds significantly statistically. (B) Pattern search for correlation analysis of metabolites correlated with cytotoxic activity. Compounds annotated significantly statistically by UHPLC-QTOF-MS from BLEs comparing Active/Inactive groups (p-value threshold <0.05 and FC threshold >2).

