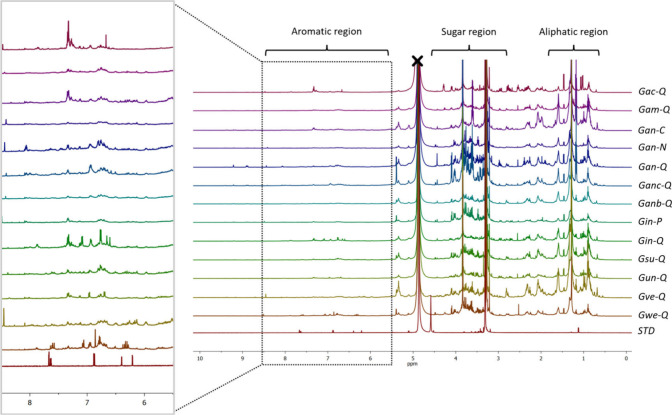
Figure 5.
Stacked representative 1H-NMR spectra of the BLEs are presented. The panels display the partial assignment of aliphatic (δH 0.90–1.50 ppm), sugar (δH 3.00–5.50 ppm), and aromatic (δH 6.50–8.55 ppm) regions, respectively. An expanded spectral region from δH 5.50 to 8.50 ppm is shown for aromatic compounds. Assignments were established by extracting signals with reference standards (Quercetin and Rutin) and based on literature reports on the NMR spectra.

