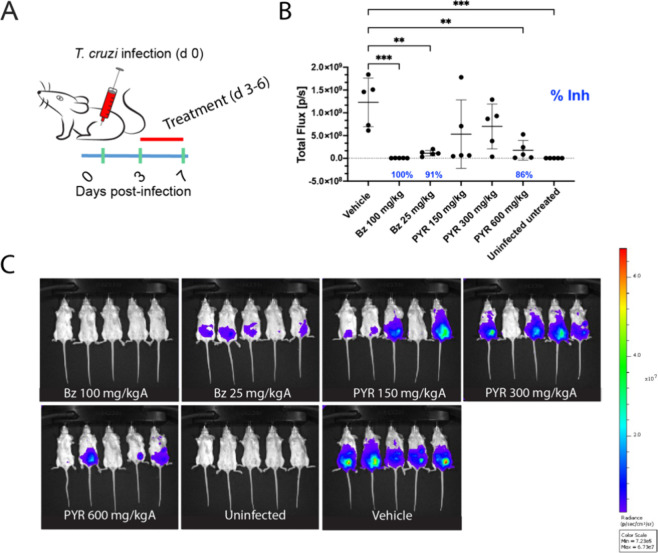
Figure 2.
Acute mouse model of Chagas disease (T. cruzi Br-Luc). (A) Dosing schedule in mice. The green bars are the days the mice are read in the IVIS. Red bar represents the treatment period (bid). (B) In vivo antiparasitic activity (day 7 postinfection) following oral dosing of pyronaridine (PYR) or benznidazole (Bz). (C) Luminescent signal in mice following the treatment with different drugs or vehicle. Statistical significance was determined using an ordinary one-way ANOVA with Dunnett’s multiple comparisons test as calculated in Graphpad Prism 10.0. Only comparisons that are statistically significant (* p ≤ 0.05, ** p ≤ 0.01, *** p ≤ 0.001, **** p ≤ 0.0001) are shown. Percent inhibition is calculated from the mean of each group as compared to the vehicle and only significant inhibition is shown.

