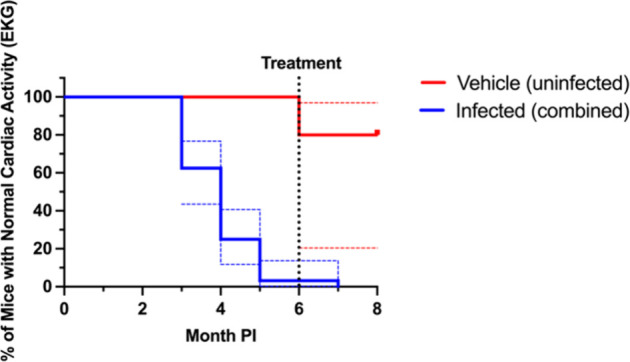
Figure 5.

Kaplan–Meier graph of cardiac abnormalities from the chronic mouse model of T. cruzi Sylvio X10/4 infection model data. An event is defined as an abnormal EKG. For experimental groups, treatment began at 6 month PI so for clarity all infected groups were combined into a single “infected group”. Blue and red dotted lines represent the 95% confidence intervals to show the variability in infected groups. PI = postinfection.
